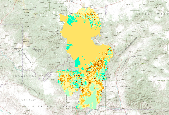
Filters: Tags: regime (X)
64 results (9ms)|
Filters
Date Range
Extensions Types Contacts Categories Tag Schemes |

This map represents the percent change in average annual vapor pressure deficit, simulated by the model MC1 between the 30-year periods 1971-2000 and 2070-2099, using the Hadley projected climate and A2 emissions scenarios. The average annual vapor pressure deficit for the respective 30-year periods decreased in all of the 5,311 grid cells of the Eastern Oregon study area. The greatest decrease was -33.04%; the least decrease was --40.97%; and the mean decrease was --36.49% The vegetation model MC1 (e.g. Bachelet et al. 2001) was used to simulate vegetation dynamics, associated carbon and nitrogen cycle, water budget, and wild fire impacts at two study sites, one in eastern Oregon (Deschutes and Fremont-Winema...

This map represents the percent change between 1971-2000 and 2071-2100 in the amount of carbon in biomass consumed by fire, as simulated by the model MC1 under the MIROC medres future climate projection and A2 anthropogenic emissions scenario. The range of data values is from -92.8% to +416.4%. The mean value is +54.3%. Data values are calculated as (CONSUMED(2071-2100) minus CONSUMED(1971-2000)) divided by CONSUMED(1971-2000). CONSUMED data is from MC1 version B60 The vegetation model MC1 (e.g. Bachelet et al. 2001) was used to simulate vegetation dynamics, associated carbon and nitrogen cycle, water budget, and wild fire impacts at two study sites in eastern Oregon (Deschutes and Fremont-Winema National Forests)...

This map represents the percent change between 1971-2000 and 2071-2100 in the amount of carbon in biomass consumed by fire, as simulated by the model MC1 under the CSIRO Mk3 future climate projection and A2 anthropogenic emissions scenario. The range of data values is from -100.0% to +1,784.6%. The mean value is +27.9%. Data values are calculated as (CONSUMED(2071-2100) minus CONSUMED(1971-2000)) divided by CONSUMED(1971-2000). CONSUMED data is from MC1 version B60. The vegetation model MC1 (e.g. Bachelet et al. 2001) was used to simulate vegetation dynamics, associated carbon and nitrogen cycle, water budget, and wild fire impacts at two study sites in eastern Oregon (Deschutes and Fremont-Winema National...

This map represents the percent change from 1971-2000 to 2070-2099 in the average annual amount of water contributed to the stream network, as simulated by the model MC1 under the Hadley future climate projection and A2 anthropogenic emissions scenario. The average annual amount of water contributed to the stream network for the respective 30-year periods decreased in some of the 5,311 grid cells of the Apache-Sitgreaves study area and increased in others.The range of data values is from -60.0% to 6.42%. The mean value is -24.41%. Data values are calculated as (STREAMFLOW(2070-2099) minus STREAMFLOW(1971-2000)) divided by STREAMFLOW(1971-2000). STREAMFLOW data is from MC1 version B60. The vegetation model MC1...

This map represents the percent change in total ecosystem carbon from 1971-2000 to 2070-2099, simulated by the model MC1 under the Hadley future climate projection and A2 anthropogenic emissions scenario. The average annual value of total ecosystem carbon for the respective 30-year periods increased in some of the 5,311 grid cells of the Apache-Sitgreaves study area and decreased in others.The range of data values is from -19.5% to +167.5%. The mean value is 33.64%. The vegetation model MC1 (e.g. Bachelet et al. 2001) was used to simulate vegetation dynamics, associated carbon and nitrogen cycle, water budget, and wild fire impacts at two study sites, one in eastern Oregon (Deschutes and Fremont-Winema National...
This map represents the percent change between 1971-2000 and 2071-2100 in the amount of carbon in biomass consumed by fire, as simulated by the model MC1 under the CSIRO Mk3 future climate projection and A2 anthropogenic emissions scenario. The range of data values is from -100.0% to +1,784.6%. The mean value is +27.9%. Data values are calculated as (CONSUMED(2071-2100) minus CONSUMED(1971-2000)) divided by CONSUMED(1971-2000). CONSUMED data is from MC1 version B60. The vegetation model MC1 (e.g. Bachelet et al. 2001) was used to simulate vegetation dynamics, associated carbon and nitrogen cycle, water budget, and wild fire impacts at two study sites in eastern Oregon (Deschutes and Fremont-Winema National Forests)...

This map represents the percent change between 1971-2000 and 2071-2100 in the amount of carbon in biomass consumed by fire, as simulated by the model MC1 under the CSIRO Mk3 future climate projection and A2 anthropogenic emissions scenario. The range of data values is from -97.4% to +331.0%. The mean value is +37.0%. Data values are calculated as (CONSUMED(2071-2100) minus CONSUMED(1971-2000)) divided by CONSUMED(1971-2000). CONSUMED data is from MC1 version B60. The vegetation model MC1 (e.g. Bachelet et al. 2001) was used to simulate vegetation dynamics, associated carbon and nitrogen cycle, water budget, and wild fire impacts at two study sites in eastern Oregon (Deschutes and Fremont-Winema National Forests)...

This map represents the modal vegetation type in each gridcell, as simulated by the model MC1 for the 30-year period 2071-2100, using the CSIRO Mk3 future climate projection under the A2 anthropogenic emission scenario. The data is from output variable VTYPE in MC1 version B60. The vegetation model MC1 (e.g. Bachelet et al. 2001) was used to simulate vegetation dynamics, associated carbon and nitrogen cycle, water budget, and wild fire impacts at two study sites in eastern Oregon (Deschutes and Fremont-Winema National Forests) and in Arizona (Apache Sitgreaves National Forest area) in the context of a project funded by the USDA Forest Service (PNW 09-JV-11261900-003). Historical climate input data used to...

This map represents the mean annual amount of carbon in biomass consumed by fire, simulated by the model MC1 for the 30-year period 1971-2000. The data is from output variable CONSUMED in MC1 version B60. The data is in units of grams of carbon per square meter; values range from 0 to 878 g C m-2 yr-1. The mean value is 24 g C m-2 yr-1.

This map represents the change between 1971-2000 and 2071-2100 in the mean annual fraction of each gridcell affected by fire, as simulated by the model MC1 under the MIROC medres future climate projection and A2 anthropogenic emissions scenario. The range of data values is from -0.076 to +0.119. The mean value is +0.023. Data values are calculated as PART_BURN(2071-2100) minus PART_BURN(1971-2000). PART_BURN data is from MC1 version B60. The vegetation model MC1 (e.g. Bachelet et al. 2001) was used to simulate vegetation dynamics, associated carbon and nitrogen cycle, water budget, and wild fire impacts at two study sites in eastern Oregon (Deschutes and Fremont-Winema National Forests) and in Arizona (Apache...

This map represents the percent change in average annual vapor pressure deficit, simulated by the model MC1 between the 30-year periods 1971-2000 and 2070-2099, using the Hadley projected climate and A2 emissions scenarios. The average annual vapor pressure deficit for the respective 30-year periods decreased in all of the 5,311 grid cells of the Apache-Sitgreaves study area. The greatest decrease was -19.16%; the least decrease was -22.55%; and the mean decrease was -20.30% The vegetation model MC1 (e.g. Bachelet et al. 2001) was used to simulate vegetation dynamics, associated carbon and nitrogen cycle, water budget, and wild fire impacts at two study sites, one in eastern Oregon (Deschutes and Fremont-Winema...
Ecological and economic systems are open systems that require energy to change the thermodynamic states of materials from naturally occurring to more valued forms. These changes are accompanied by information flows and changes in the order of systems and their surroundings. In this paper, thermodynamics is used to assess these system changes and relate them to the knowledge present in a system. Particular emphasis is given to (1) the fundamental relationships among material, energy and information flows, and changes in order and knowledge, (2) the role of equilibrium and non-equilibrium thermodynamics in assessing system change, (3) the increasing role of material and energy flows through economic systems, and (4)...
Categories: Publication;
Types: Citation;
Tags: climate,
institutionalisation,
international,
regime,
trust

This map represents the percent change from 1971-2000 to 2071-2100 in the average annual amount of water contributed to the stream network, as simulated by the model MC1 under the MIROC medres future climate projection and A2 anthropogenic emissions scenario. The range of data values is from -67.0% to -12.4%. The mean value is -46.1%. Data values are calculated as (STREAMFLOW(2071-2100) minus STREAMFLOW(1971-2000)) divided by STREAMFLOW(1971-2000). STREAMFLOW data is from MC1 version B60. The vegetation model MC1 (e.g. Bachelet et al. 2001) was used to simulate vegetation dynamics, associated carbon and nitrogen cycle, water budget, and wild fire impacts at two study sites in eastern Oregon (Deschutes and Fremont-Winema...

This map represents the percent change in average annual vapor pressure deficit, simulated by the model MC1 between the 30-year periods 1970-2000 and 2071-2100, using the MIROC medres projected climate and A2 emissions scenarios. The vegetation model MC1 (e.g. Bachelet et al. 2001) was used to simulate vegetation dynamics, associated carbon and nitrogen cycle, water budget, and wild fire impacts at two study sites in eastern Oregon (Deschutes and Fremont-Winema National Forests) and in Arizona (Apache Sitgreaves National Forest area) in the context of a project funded by the USDA Forest Service (PNW 09-JV-11261900-003). Historical climate input data used to run the model were provided by the PRISM group (Chris...

This map represents the percent change in average annual vapor pressure deficit, simulated by the model MC1 between the 30-year periods 1970-2000 and 2071-2100, using the CSIRO Mk3 future climate projection and A2 emissions scenario. The vegetation model MC1 (e.g. Bachelet et al. 2001) was used to simulate vegetation dynamics, associated carbon and nitrogen cycle, water budget, and wild fire impacts at two study sites in eastern Oregon (Deschutes and Fremont-Winema National Forests) and in Arizona (Apache Sitgreaves National Forest area) in the context of a project funded by the USDA Forest Service (PNW 09-JV-11261900-003). Historical climate input data used to run the model were provided by the PRISM group (Chris...

This map represents the mean annual fraction of the gridcell affected by wildfire, simulated by the model MC1 for the 30-year period 1971-2000. The data is from output variable PART_BURN in MC1 version B60. The data is a unitless fraction; values range from 0 to 0.110. The mean value is 0.008.

This map represents the difference in annual minimum temperatures, simulated by the model MC1 between the 30-year periods 1970-2000 and 2070-2100, using the MIROC medres future climate projection under the A2 anthropogenic emission scenario. The vegetation model MC1 (e.g. Bachelet et al. 2001) was used to simulate vegetation dynamics, associated carbon and nitrogen cycle, water budget, and wild fire impacts at two study sites in eastern Oregon (Deschutes and Fremont-Winema National Forests) and in Arizona (Apache Sitgreaves National Forest area) in the context of a project funded by the USDA Forest Service (PNW 09-JV-11261900-003). Historical climate input data used to run the model were provided by the PRISM...

This map represents the difference in annual maximum temperatures, simulated by the model MC1 between the 30-year periods 1970-2000 and 2070-2100, using the CSIRO-Mk3 future climate projection under the A2 anthropogenic emission scenario (warm and dry). The vegetation model MC1 (e.g. Bachelet et al. 2001) was used to simulate vegetation dynamics, associated carbon and nitrogen cycle, water budget, and wild fire impacts at two study sites in eastern Oregon (Deschutes and Fremont-Winema National Forests) and in Arizona (Apache Sitgreaves National Forest area) in the context of a project funded by the USDA Forest Service (PNW 09-JV-11261900-003). Historical climate input data used to run the model were provided by...

This map represents the change between 1971-2000 and 2071-2100 in the mean annual fraction of each gridcell affected by fire, as simulated by the model MC1 under the CSIRO Mk3 future climate projection and A2 anthropogenic emissions scenario. The range of data values is from -0.079 to +0.133. The mean value is +0.010. Data values are calculated as PART_BURN(2071-2100) minus PART_BURN(1971-2000). PART_BURN data is from MC1 version B60. The vegetation model MC1 (e.g. Bachelet et al. 2001) was used to simulate vegetation dynamics, associated carbon and nitrogen cycle, water budget, and wild fire impacts at two study sites in eastern Oregon (Deschutes and Fremont-Winema National Forests) and in Arizona (Apache...

This dataset represents the soil moisure regimes from SSURGO and STATSTO soil descriptions for soil map units in the state of western Washington that lie within the North Pacific Landscape Conservation Cooperative. The term 'soil moisture regime' refers to the presence or absence either of ground water or of water held at a tension of less than 1500 kPa in the soil or in specific horizons during periods of the year. Water held at a tension of 1500 kPa or more is not available to keep most mesophytic plants alive. The availability of water is also affected by dissolved salts. If a soil is saturated with water that is too salty to be available to most plants, it is considered salty rather than dry. Consequently,...
|

|
