Filters: Tags: shoreline (X)
429 results (161ms)|
Filters
Date Range
Extensions Types
Contacts
Categories Tag Types
|
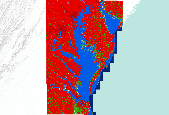
The U.S. Geological Survey (USGS) has compiled national shoreline data for more than 20 years to document coastal change and serve the needs of research, management, and the public. Maintaining a record of historical shoreline positions is an effective method to monitor national shoreline evolution over time, enabling scientists to identify areas most susceptible to erosion or accretion. These data can help coastal managers and planners understand which areas of the coast are vulnerable to change. This data release includes a compilation of previously published historical shoreline positions for Virginia spanning 148 years (1849-1997), and two new mean high water (MHW) shorelines extracted from lidar data collected...
Categories: Data;
Types: Downloadable,
Map Service,
OGC WFS Layer,
OGC WMS Layer,
Shapefile;
Tags: Accretion,
Atlantic Coast,
Atlantic Coast,
Baseline,
DSAS,
The goal of this project is to provide a preliminary overview, at a National scale, the relative susceptibility of the Nation's coast to sea- level rise through the use of a coastal vulnerability index (CVI). This initial classification is based upon the variables geomorphology, regional coastal slope, tide range, wave height, relative sea-level rise and shoreline erosion and accretion rates. The combination of these variables and the association of these variables to each other furnish a broad overview of regions where physical changes are likely to occur due to sea-level rise.
Categories: Data;
Types: ArcGIS REST Map Service,
ArcGIS Service Definition,
Downloadable,
Map Service;
Tags: Alabama (AL),
Beach,
Beach Erosion,
Coastal Geomorphology,
Coastal Hazards,
An indicator of relative sediment delivery at the river mouth for each of over 3,000 watersheds draining into the Caribbean Sea and Gulf of Mexico.
Categories: Data;
Types: ArcGIS REST Map Service,
ArcGIS Service Definition,
Downloadable,
Map Service;
Tags: Alabama (AL),
Caribbean,
Florida (FL),
Gulf of Mexico,
Gulf of Mexico,
These data were created as part of the National Oceanic and Atmospheric Administration Coastal Services Center's efforts to create an online mapping viewer depicting potential sea level rise and its associated impacts on the nation's coastal areas. The purpose of the mapping viewer is to provide coastal managers and scientists with a preliminary look at sea level rise (slr) and coastal flooding impacts. The viewer is a screening-level tool that uses nationally consistent data sets and analyses.Data and maps provided can be used at several scales to help gauge trends and prioritize actions for different scenarios. The Sea Level Rise and Coastal Flooding Impacts Viewer may be accessed at: http://www.csc.noaa.gov/slr...
The U.S. Geological Survey (USGS) has compiled national shoreline data for more than 20 years to document coastal change and serve the needs of research, management, and the public. Maintaining a record of historical shoreline positions is an effective method to monitor national shoreline evolution over time, enabling scientists to identify areas most susceptible to erosion or accretion. These data can help coastal managers and planners understand which areas of the coast are vulnerable to change. This data release includes one new mean high water (MHW) shoreline extracted from lidar data collected in 2017 for the entire coastal region of North Carolina which is divided into four subregions: northern North Carolina...
Categories: Data;
Types: Downloadable,
Map Service,
OGC WFS Layer,
OGC WMS Layer,
Shapefile;
Tags: Atlantic Coast,
DSAS,
Digital Shoreline Analysis System,
MHW,
Mean High Water,
The data in this release re-map the beach and nearshore environment at Head of the Meadow Beach in Truro, MA and provide updated environmental context for the 2020 CoastCam installation that looks out at the coast shared by beachgoers, shorebirds, seals, and sharks. This is related to the field activity 2022-015-FA and a collaboration with the National Park Service at Cape Cod National Seashore to monitor the region that falls within the field of view of CoastCam CACO-01, which are two video cameras aimed at the beach. In March and April 2023, U.S. Geological Survey and Woods Hole Oceanographic Institute (WHOI) scientists conducted field surveys to collect topographic and bathymetric data. Images of the beach for...
Categories: Data;
Tags: ASV,
CMHRP,
Cape Cod,
Coastal and Marine Hazards and Resources Program,
Head of the Meadow Beach,
The data in this release re-map the beach and nearshore environment at Head of the Meadow Beach in Truro, MA and provide updated environmental context for the 2020 CoastCam installation that looks out at the coast shared by beachgoers, shorebirds, seals, and sharks. This is related to the field activity 2022-015-FA and a collaboration with the National Park Service at Cape Cod National Seashore to monitor the region that falls within the field of view of CoastCam CACO-01, which are two video cameras aimed at the beach. In March and April 2023, U.S. Geological Survey and Woods Hole Oceanographic Institute (WHOI) scientists conducted field surveys to collect topographic and bathymetric data. Images of the beach for...
Low-altitude (80-100 meters above ground level) digital images were obtained from a camera mounted on a 3DR Solo quadcopter, a small unmanned aerial system (UAS), in three locations along the Lake Ontario shoreline in New York during July 2017. These data were collected to document and monitor effects of high lake levels, including shoreline erosion, inundation, and property damage in the vicinity of Chimney Bluffs State Park, New York. This data release includes images tagged with locations determined from the UAS GPS; tables with updated estimates of camera positions and attitudes based on the photogrammetric reconstruction; tables listing locations of the base stations, ground control points, and transect points;...
Sandy ocean beaches in the United States are popular tourist and recreational destinations and constitute some of the most valuable real estate in the country. The boundary between land and water along the coastline is often the location of concentrated residential and commercial development and is frequently exposed to a range of natural hazards, which include flooding, storm effects, and coastal erosion. In response, the U.S. Geological Survey (USGS) is conducting a national assessment of coastal change hazards. One component of this research effort, the National Assessment of Shoreline Change Project, documents changes in shoreline position as a proxy for coastal change. Shoreline position is an easily understood...
Categories: Data;
Types: Citation,
Downloadable,
Map Service,
OGC WFS Layer,
OGC WMS Layer,
Shapefile;
Tags: Accretion,
Bald Point State Park,
CMGP,
Coastal and Marine Geology Program,
DSAS,
This dataset is part of an extensive analysis of sea-level rise impacts on coastal habitats along the Chesapeake Bay, Delaware Bay, and the ocean beaches of southern New Jersey, Delaware, Maryland, and Virginia. The National Wildlife Federation commissioned Jonathan S. Clough of Warren Pinnacle Consulting, Inc., to apply the Sea Level Affecting Marshes Model (SLAMM, Version 5.0) to the Chesapeake Bay region. The SLAMM model is widely regarded as the premier research tool for simulating the dominant processes involved in wetland conversions and shoreline modifications during long-term sea-level rise. Our analysis looked at a range of sea-level rise scenarios from the 2001 Intergovernmental Panel on Climate Change...
This geodatabase contains streams, waterbodies and wetlands, streamflow gaging stations, and coastlines for the conterminous United States. The streams are incorporated into a geometric network. All feature classes are vertically integrated with each other and with 1:1,000,000-scale transportation and boundary data sets.
The Massachusetts Office of Coastal Zone Management launched the Shoreline Change Project in 1989 to identify erosion-prone areas of the coast. The shoreline position and change rate are used to inform management decisions regarding the erosion of coastal resources. In 2001, a shoreline from 1994 was added to calculate both long- and short-term shoreline change rates along ocean-facing sections of the Massachusetts coast. In 2013, two oceanfront shorelines for Massachusetts were added using 2008-9 color aerial orthoimagery and 2007 topographic lidar datasets obtained from the National Oceanic and Atmospheric Administration's Ocean Service, Coastal Services Center. This 2018 data release includes rates that incorporate...
Categories: Data;
Types: Downloadable,
Map Service,
OGC WFS Layer,
OGC WMS Layer,
Shapefile;
Tags: Atlantic Coast,
CMGP,
Cape Cod,
Coastal and Marine Geology Program,
DSAS,
The Massachusetts Office of Coastal Zone Management launched the Shoreline Change Project in 1989 to identify erosion-prone areas of the coast. The shoreline position and change rate are used to inform management decisions regarding the erosion of coastal resources. In 2001, a 1994 shoreline was added to calculate both long- and short-term shoreline change rates at 40-meter intervals along ocean-facing sections of the Massachusetts coast. In 2013 two oceanfront shorelines for Massachusetts were added using 2008-2009 color aerial orthoimagery and 2007 topographic lidar datasets obtained from NOAA's Ocean Service, Coastal Services Center. This 2018 update includes two new mean high water (MHW) shorelines for the Massachusetts...
Categories: Data;
Types: Downloadable,
Map Service,
OGC WFS Layer,
OGC WMS Layer,
Shapefile;
Tags: Atlantic Coast,
Coastal and Marine Geology Program,
DSAS,
Database IV format,
Digital Shoreline Analysis System,

This dataset is part of an extensive analysis of sea-level rise impacts on coastal habitats along the Chesapeake Bay, Delaware Bay, and the ocean beaches of southern New Jersey, Delaware, Maryland, and Virginia. The National Wildlife Federation commissioned Jonathan S. Clough of Warren Pinnacle Consulting, Inc., to apply the Sea Level Affecting Marshes Model (SLAMM, Version 5.0) to the Chesapeake Bay region. The SLAMM model is widely regarded as the premier research tool for simulating the dominant processes involved in wetland conversions and shoreline modifications during long-term sea-level rise. Our analysis looked at a range of sea-level rise scenarios from the 2001 Intergovernmental Panel on Climate Change...

This data set contains lines representing the shoreline and coastal habitats in Puget Sound and Strait of Juan de Fuca, Washington, classified according to the Environmental Sensitivity Index (ESI) classification system. This data set comprises a portion of the ESI data for Puget Sound and Strait of Juan de Fuca. ESI data characterize the marine and coastal environments and wildlife by their sensitivity to spilled oil. The ESI data include information for three main components: shoreline habitats, sensitive biological resources, and human-use resources. This data set comprises a portion of the Environmental Sensitivity Index (ESI) data for Puget Sound and Strait of Juan de Fuca, Washington. ESI data characterize...
The Massachusetts Office of Coastal Zone Management launched the Shoreline Change Project in 1989 to identify erosion-prone areas of the coast. The shoreline position and change rate are used to inform management decisions regarding the erosion of coastal resources. In 2001, a 1994 shoreline was added to calculate both long- and short-term shoreline change rates at 40-meter intervals along ocean-facing sections of the Massachusetts coast. In 2013 two oceanfront shorelines for Massachusetts were added using 2008-2009 color aerial orthoimagery and 2007 topographic lidar datasets obtained from NOAA's Ocean Service, Coastal Services Center. This 2018 update includes two new mean high water (MHW) shorelines for the Massachusetts...
Sandy ocean beaches in the United States are popular tourist and recreational destinations and constitute some of the most valuable real estate in the country. The boundary between land and water along the coastline is often the location of concentrated residential and commercial development and is frequently exposed to a range of natural hazards, which include flooding, storm effects, and coastal erosion. In response, the U.S. Geological Survey (USGS) is conducting a national assessment of coastal change hazards. One component of this research effort, the National Assessment of Shoreline Change Project (http://coastal.er.usgs.gov/shoreline-change/), documents changes in shoreline position as a proxy for coastal...
Categories: Data;
Types: Citation,
Downloadable,
Map Service,
OGC WFS Layer,
OGC WMS Layer,
Shapefile;
Tags: Atlantic Coast,
Baseline,
CMGP,
Coastal and Marine Geology Program,
DSAS,
The smoothed shoreline is based on the NOAA Continually Updated Shoreline Products (CUSP) found at: http://shoreline.noaa.gov/data/datasheets/cusp.html. The shoreline from Point Conception to LA Harbor was smoothed with a window of 400 m in ArcGIS 10.2.2. The smoothed shoreline was splited in 82 segments (ID range 1 to 82) and for each segment a buffer distance in meters was recorded in the attribute table (dist_buff column).
Categories: Data;
Types: Downloadable,
Map Service,
OGC WFS Layer,
OGC WMS Layer,
Shapefile;
Tags: California,
Los Angeles Harbor,
Point Conception,
shoreline,
smoothed
The Massachusetts Office of Coastal Zone Management launched the Shoreline Change Project in 1989 to identify erosion-prone areas of the coast by compiling a database of historical (mid 1800's-1989) shoreline positions. Trends of shoreline position over long and short-term timescales provide information to landowners, managers, and potential buyers about possible future impacts to coastal resources and infrastructure. In 2001, a 1994 shoreline was added to calculate both long- and short-term shoreline change rates along ocean-facing sections of the Massachusetts coast. In 2013, two oceanfront shorelines for Massachusetts were added using 2008-2009 color aerial orthoimagery and 2007 topographic lidar datasets obtained...
Categories: Data;
Types: Downloadable,
Map Service,
OGC WFS Layer,
OGC WMS Layer,
Shapefile;
Tags: Atlantic Coast,
Baseline,
Buzzards Bay,
CMGP,
Coastal and Marine Geology Program,
|

|
