Filters: Tags: simulation (X)
408 results (155ms)|
Filters
|

MC1 is a dynamic vegetation model for estimating the distribution of vegetation and associated ecosystem fluxes of carbon, nutrients, and water. It was created to assess the potential impacts of global climate change on ecosystem structure and function at a wide range of spatial scales from landscape to global. The model incorporates transient dynamics to make predictions about the patterns of ecological change. MC1 was created by combining physiologically based biogeographic rules defined in the MAPSS model with a modified version of the biogeochemical model, CENTURY. MC1 includes a fire module, MCFIRE, that mechanistically simulates the occurrence and impacts of fire events. Climate input data sources for this...

Soil residual water corresponds to the model variable "total streamflow." In the model MC1, this is calculated (in cm of water) as the water flowing through the soil profile below the last soil layer (streamflow), water leached into the subsoil (baseflow) and also includes runoff. The output is presented here as a monthly average. Soil residual water is part of the model output from Brendan Rogers' MS thesis work. Brendan used the vegetation model MC1 to simulate vegetation dynamics, associated carbon and nitrogen cycle, water budget and wild fire impacts across the western 2/3 of the states of Oregon and Washington using climate input data from the PRISM group (Chris Daly, OSU) at a 30arc second (800m) spatial...

Soil residual water corresponds to the model variable "total streamflow." In the model MC1, this is calculated (in cm of water) as the water flowing through the soil profile below the last soil layer (streamflow), water leached into the subsoil (baseflow) and also includes runoff. The output is presented here as a monthly average. Soil residual water is part of the model output from Brendan Rogers' MS thesis work. Brendan used the vegetation model MC1 to simulate vegetation dynamics, associated carbon and nitrogen cycle, water budget and wild fire impacts across the western 2/3 of the states of Oregon and Washington using climate input data from the PRISM group (Chris Daly, OSU) at a 30arc second (800m) spatial...

Soil residual water corresponds to the model variable "total streamflow." In the model MC1, this is calculated (in cm of water) as the water flowing through the soil profile below the last soil layer (streamflow), water leached into the subsoil (baseflow) and also includes runoff. The output is presented here as a monthly average. Soil residual water is part of the model output from Brendan Rogers' MS thesis work. Brendan used the vegetation model MC1 to simulate vegetation dynamics, associated carbon and nitrogen cycle, water budget and wild fire impacts across the western 2/3 of the states of Oregon and Washington using climate input data from the PRISM group (Chris Daly, OSU) at a 30arc second (800m) spatial...

Soil residual water corresponds to the model variable "total streamflow." In the model MC1, this is calculated (in cm of water) as the water flowing through the soil profile below the last soil layer (streamflow), water leached into the subsoil (baseflow) and also includes runoff. The output is presented here as a monthly average. Soil residual water is part of the model output from Brendan Rogers' MS thesis work. Brendan used the vegetation model MC1 to simulate vegetation dynamics, associated carbon and nitrogen cycle, water budget and wild fire impacts across the western 2/3 of the states of Oregon and Washington using climate input data from the PRISM group (Chris Daly, OSU) at a 30arc second (800m) spatial...

Soil residual water corresponds to the model variable "total streamflow." In the model Mc1, this is calculated (in cm of water) as the water flowing through the soil profile below the last soil layer (streamflow), Water leached in the subsoil (baseflow) and also includes runoff. the output is prsented here as a monthly average. Soil residual water is part of the model output from Brendan Rogers' MS thesis work. Brendan used the vegetation model MC1 to simulate vegetation dynamics, associated carbon and nitrogen cycle, water budget and wild fire impacts across the western 2/3 of the states of Oregon and Washington using climate input data from the PRISM group (Chris Daly, OSU) at a 30arc second (800m) spatial grain....
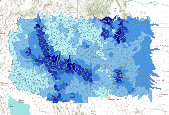
This dataset represents the average annual amount of water contributed to the stream network for each watershed, simulated by the model MC1 for the 30-year period 1971-2000. Simulated mean streamflow (stormflow + baseflow + runoff) was determined for each HUC5 watershed. Watersheds represent 5th level (HUC5, 10-digit) hydrologic unit boundaries and were acquired from the Natural Resources Conservation Service. Streamflow units are comparable to rainfall - millimeters of water per year. Background: The dynamic global vegetation model MC1 (see Bachelet et al. 2001) was used to simulate vegetation dynamics, associated carbon and nitrogen cycle, water budget, and wild fire impacts for OR, WA, AZ and NM, for a project...
This study proposes a new use of Data Envelopment Analysis (DEA) to measure the operational, environmental and both-unified efficiency measures of US coal-fired power plants. The power plants produce not only desirable outputs (e.g., electricity) but also undesirable outputs (e.g., CO2 and NOx) as a result of their plant operations. A Range-Adjusted Measure (RAM) is used as an original non-radial DEA model. Then, it is reformulated for handling undesirable (bad) outputs. The proposed use of DEA models measures the environmental and unified performance of power plants under two variable alternatives (with and without CO2 emission control) in order to examine both the influence of US Clean Air Act (CAA) on the acid...
The Swedish programme for geological disposal of spent nuclear fuel is approaching major milestones in the form of permit applications for an encapsulation plant and a deep geologic repository. This paper presents an overview of the bedrock and surface modelling work that comprises a major part of the on-going site characterization in Sweden and that results in syntheses of the sites, called site descriptions. The site description incorporates descriptive models of the site and its regional setting, including the current state of the geosphere and the biosphere as well as natural processes affecting long-term evolution. The site description is intended to serve the needs of both repository engineering with respect...

This dataset represents the average amount of soil carbon within each HUC5 watershed, simulated by the model MC1 for the 30-year period 1971-2000. Soil carbon, in g m-2, was determined for each HUC5 watershed. Watersheds represent 5th level (HUC5, 10-digit) hydrologic unit boundaries and were acquired from the Natural Resources Conservation Service. Background: The dynamic global vegetation model MC1 (see Bachelet et al.2001) was used to simulate vegetation dynamics, associated carbon and nitrogen cycle, water budget, and wild fire impacts for OR, WA, AZ and NM, for a project funded by the USDA Forest Service (PNW09-JV-11261900-003). The MC1 model was run using historical data and future climate change projections...
This dataset represents the average net primary production for each HUC5 watershed, simulated by the model MC1 for the 30-year period 1971-2000. Mean net primary production (in g m-2 per yr), was determined for each HUC5 watershed by averaging values of original ~ 4 km raster data. Watersheds represent 5th level (HUC5, 10-digit) hydrologic unit boundaries and were acquired from the Natural Resources Conservation Service. Background: The dynamic global vegetation model MC1 (see Bachelet et al.2001) was used to simulate vegetation dynamics, associated carbon and nitrogen cycle, water budget, and wild fire impacts for OR, WA, AZ and NM, for a project funded by the USDA Forest Service (PNW09-JV-11261900-003). The MC1...

This map shows the predicted area of high fire potential for the current year up to the end of the forecast period as simulated by a modified version of the MC1 Dynamic General Vegetation Model (DGVM). Different colors indicate the level of consensus among five different MC1 simulations (i.e., one for each forecast provided by five different weather models), ranging from one of five to five of five simulations predicting high fire potential. The area of high fire potential is where PDSI and MC1-calculated values of potential fire behavior (fireline intensity for forest and shrubland and rate of spread of spread for grassland) exceed calibrated threshold values. Potential fire behavior in MC1 is estimated using...

This map shows the predicted area of high fire potential for the current year up to the end of the forecast period as simulated by a modified version of the MC1 Dynamic General Vegetation Model (DGVM). Different colors indicate the level of consensus among five different MC1 simulations (i.e., one for each forecast provided by five different weather models), ranging from one of five to five of five simulations predicting high fire potential. The area of high fire potential is where PDSI and MC1-calculated values of potential fire behavior (fireline intensity for forest and shrubland and rate of spread of spread for grassland) exceed calibrated threshold values. Potential fire behavior in MC1 is estimated using...

This map represents the change between 1971-2000 and 2070-2099 in the mean annual fraction of each gridcell affected by fire, as simulated by the model MC1 under the Hadley future climate projection and A2 anthropogenic emissions scenario. Data values are calculated as PART_BURN(2070-2099) minus PART_BURN(1971-2000). PART_BURN data is from MC1 version B60. The average annual fraction of cell burned for the respective 30-year periods increased in some of the 5,311 grid cells of the Apache-Sitgreaves study area and decreased in others. The range of data values is from -0.077 to +0.163. The mean value is +0.031. The vegetation model MC1 (e.g. Bachelet et al. 2001) was used to simulate vegetation dynamics, associated...

MC1 is a dynamic vegetation model for estimating the distribution of vegetation and associated ecosystem fluxes of carbon, nutrients, and water. It was created to assess the potential impacts of global climate change on ecosystem structure and function at a wide range of spatial scales from landscape to global. The model incorporates transient dynamics to make predictions about the patterns of ecological change. MC1 was created by combining physiologically based biogeographic rules defined in the MAPSS model with a modified version of the biogeochemical model, CENTURY. MC1 includes a fire module, MCFIRE, that mechanistically simulates the occurrence and impacts of fire events. Climate input data sources for this...

This map represents the change between 1971-2000 and 2071-2100 in the annual peak fraction of total live vegetation carbon held in herbaceous plants, as simulated by the model MC1 under the CSIRO Mk3 future climate projection and A2 anthropogenic emissions scenario. The range of data values is from -0.741 to +0.999. The mean value is +0.107. Data values are calculated as GFRAC(2071-2100) minus GFRAC(1971-2000). GFRAC data is from MC1 version B60. The dynamic global vegetation model MC1 (e.g. Bachelet et al. 2001) was used to simulate vegetation dynamics, associated carbon and nitrogen cycle, water budget, and wild fire impacts at two study sites in eastern Oregon (Deschutes and Fremont-Winema National Forests)...
Researchers representing each of the Colorado River Basin states as well as the Secretary of the Interior were presented with an interactive computer simulation of a progressively increasing drought and were given the collective opportunity to change the ways in which basin-wide and within-state water management were conducted. The purpose of this ?gaming? exercise was to identify rules for managing the Colorado River which are effective in preventing drought-caused damages to basin water users. This water management game was conducted three times, varying the collective choice roles for management of the river yet staying substantially within the current institution for management of the Colorado River known as...
Categories: Publication;
Types: Citation,
Journal Citation;
Tags: Colorado River Basin,
Journal of the American Water Resources Association,
drought,
gaming,
institutions,

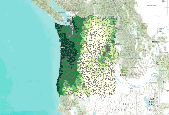
Change in the majority generalized vegetation type for each HUC5 watershed between historical (1971-2000) and future (2071-2100) time periods. The MC1 dynamic vegetation model was run under the CSIRO, MIROC, and Hadley climate change projections and the A2 anthropogenic emissions scenario. Majority generalized vegetation type was determined for each HUC5 watershed from from original ~ 4 km raster data. Generalized vegetation types were assigned by combining detailed MC1 vegetation classes into four general catagories: desert, grassland, shrubland, and forest. Watersheds represent 5th level (HUC5, 10-digit) hydrologic unit boundaries and were acquired from the Natural Resources Conservation Service. Background:...

This map represents the percent change in total ecosystem carbon from 1971-2000 to 2070-2099, simulated by the model MC1 under the Hadley future climate projection and A2 anthropogenic emissions scenario. The average annual value of total ecosystem carbon for the respective 30-year periods decreased in some of the 5,311 grid cells of the Eastern Oregon study area and increased in others.The range of data values is from -18.2% to +194.1%. The mean value is -78.0% The vegetation model MC1 (e.g. Bachelet et al. 2001) was used to simulate vegetation dynamics, associated carbon and nitrogen cycle, water budget, and wild fire impacts at two study sites, one in eastern Oregon (Deschutes and Fremont-Winema National Forests)...

This map represents the difference in annual minimum temperatures, simulated by the model MC1 between the 30-year periods 1971-2000 and 2070-2099, using the Hadley future climate projection under the A2 anthropogenic emission scenario. The average annual minimum temperature for the respective 30-year periods increased in all of the 5,311 grid cells of the Apache-Sitgreaves study area. The greatest increase was 4.35 C; the least increase was 4.26 C; and the mean increase was 4.31 C. The vegetation model MC1 (e.g. Bachelet et al. 2001) was used to simulate vegetation dynamics, associated carbon and nitrogen cycle, water budget, and wild fire impacts at two study sites in eastern Oregon (Deschutes and Fremont-Winema...
|

|
