Filters: Tags: soil (X) > partyWithName: Conservation Biology Institute (X)
256 results (12ms)|
Filters
|

Soil residual water corresponds to the model variable "total streamflow." In the model MC1, this is calculated (in cm of water) as the water flowing through the soil profile below the last soil layer (streamflow), water leached into the subsoil (baseflow) and also includes runoff. The output is presented here as a monthly average. Soil residual water is part of the model output from Brendan Rogers' MS thesis work. Brendan used the vegetation model MC1 to simulate vegetation dynamics, associated carbon and nitrogen cycle, water budget and wild fire impacts across the western 2/3 of the states of Oregon and Washington using climate input data from the PRISM group (Chris Daly, OSU) at a 30arc second (800m) spatial...

Soil residual water corresponds to the model variable "total streamflow." In the model MC1, this is calculated (in cm of water) as the water flowing through the soil profile below the last soil layer (streamflow), water leached into the subsoil (baseflow) and also includes runoff. The output is presented here as a monthly average. Soil residual water is part of the model output from Brendan Rogers' MS thesis work. Brendan used the vegetation model MC1 to simulate vegetation dynamics, associated carbon and nitrogen cycle, water budget and wild fire impacts across the western 2/3 of the states of Oregon and Washington using climate input data from the PRISM group (Chris Daly, OSU) at a 30arc second (800m) spatial...

Soil residual water corresponds to the model variable "total streamflow." In the model MC1, this is calculated (in cm of water) as the water flowing through the soil profile below the last soil layer (streamflow), water leached into the subsoil (baseflow) and also includes runoff. The output is presented here as a monthly average. Soil residual water is part of the model output from Brendan Rogers' MS thesis work. Brendan used the vegetation model MC1 to simulate vegetation dynamics, associated carbon and nitrogen cycle, water budget and wild fire impacts across the western 2/3 of the states of Oregon and Washington using climate input data from the PRISM group (Chris Daly, OSU) at a 30arc second (800m) spatial...

Soil residual water corresponds to the model variable "total streamflow." In the model MC1, this is calculated (in cm of water) as the water flowing through the soil profile below the last soil layer (streamflow), water leached into the subsoil (baseflow) and also includes runoff. The output is presented here as a monthly average. Soil residual water is part of the model output from Brendan Rogers' MS thesis work. Brendan used the vegetation model MC1 to simulate vegetation dynamics, associated carbon and nitrogen cycle, water budget and wild fire impacts across the western 2/3 of the states of Oregon and Washington using climate input data from the PRISM group (Chris Daly, OSU) at a 30arc second (800m) spatial...

Soil residual water corresponds to the model variable "total streamflow." In the model Mc1, this is calculated (in cm of water) as the water flowing through the soil profile below the last soil layer (streamflow), Water leached in the subsoil (baseflow) and also includes runoff. the output is prsented here as a monthly average. Soil residual water is part of the model output from Brendan Rogers' MS thesis work. Brendan used the vegetation model MC1 to simulate vegetation dynamics, associated carbon and nitrogen cycle, water budget and wild fire impacts across the western 2/3 of the states of Oregon and Washington using climate input data from the PRISM group (Chris Daly, OSU) at a 30arc second (800m) spatial grain....

This dataset represents the average amount of soil carbon within each HUC5 watershed, simulated by the model MC1 for the 30-year period 1971-2000. Soil carbon, in g m-2, was determined for each HUC5 watershed. Watersheds represent 5th level (HUC5, 10-digit) hydrologic unit boundaries and were acquired from the Natural Resources Conservation Service. Background: The dynamic global vegetation model MC1 (see Bachelet et al.2001) was used to simulate vegetation dynamics, associated carbon and nitrogen cycle, water budget, and wild fire impacts for OR, WA, AZ and NM, for a project funded by the USDA Forest Service (PNW09-JV-11261900-003). The MC1 model was run using historical data and future climate change projections...
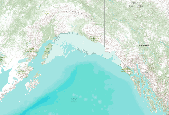
This dataset represents the soil pH from SSURGO and STATSGO soil descriptions for soil map units in the state of southern Alaska that lie within the North Pacific Landscape Conservation Cooperative.

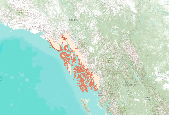
This dataset represents the soil pH from SSURGO and STATSGO soil descriptions for soil map units in the state of western Washington that lie within the North Pacific Landscape Conservation Cooperative.

This dataset represents the soil temperature regimes from SSURGO and STATSGO soil descriptions for soil map units in the state of southern Alaska (b) that lie within the North Pacific Landscape Conservation Cooperative. Definition.—“Soil temperature” is the mean monthly soil temperature at the specified depth (the average of the daily high and daily low temperature for the month). Significance.—Soil temperature is important to many biological and physical processes that occur in the soil. Plant germination and growth are closely related to soil temperature. Cold soil temperatures effectively create a thermal pan in the soil. Roots cannot uptake moisture or nutrients below the threshold temperatures specific to...

Clay percentage was summarized from SSURGO and STATSGO tabular data, joined to source feature data from the NRCS, and then converted to an 800m raster using the cell center to assign the values. This data set is a digital soil survey and generally is the most detailed level of soil geographic data developed by the National Cooperative Soil Survey. The information was prepared by digitizing maps, by compiling information onto a planimetric correct base and digitizing, or by revising digitized maps using remotely sensed and other information. This data set consists of georeferenced digital map data and computerized attribute data. The map data are in a soil survey area extent format and include a detailed, field verified...

Clay percentage was summarized from SSURGO and STATSGO tabular data, joined to source feature data from the NRCS, and then converted to an 800m raster using the cell center to assign the values. This data set is a digital soil survey and generally is the most detailed level of soil geographic data developed by the National Cooperative Soil Survey. The information was prepared by digitizing maps, by compiling information onto a planimetric correct base and digitizing, or by revising digitized maps using remotely sensed and other information. This data set consists of georeferenced digital map data and computerized attribute data. The map data are in a soil survey area extent format and include a detailed, field verified...

This dataset represents the soil moisure regimes from SSURGO and STATSTO soil descriptions for soil map units in the state of northern California that lie within the North Pacific Landscape Conservation Cooperative. "The term 'soil moisture regime' refers to the presence or absence either of ground water or of water held at a tension of less than 1500 kPa in the soil or in specific horizons during periods of the year. Water held at a tension of 1500 kPa or more is not available to keep most mesophytic plants alive. The availability of water is also affected by dissolved salts. If a soil is saturated with water that is too salty to be available to most plants, it is considered salty rather than dry. Consequently,...

This set of soils data consists of bulk density, mineral depth, and three layers each of sand, clay, and rock fragment fractions. The soils data were obtained from Kern (2000), using methodology from Kern (1995) with corrected inconsistencies and gap filling from NRCS (1994).

Soil maps for the State Soil Geographic Database (STATSGO) were developed by the NRCS. Detailed county-level soil survey data were generalized into state based coverages and each state edge-matched to form a seamless nation-wide database for soils. The mapping scale for STATSGO is 1:250,000 (with the exception of alaska, which is 1:1,000,000). The level of mapping is designed to be used for broad planning and management covering state, regional, and multi-state areas. STATSGO data are available for the conterminous U.S., Alaska, Hawaii, and Puerto Rico. This data layer was produced by extracting soil temperature attributes from the NRCS - STATSGO data layers for the 11 western states. Map types represent most prevalent...

This set of soils data consists of mineral depth, and three layers each of sand, clay, and rock fragment fractions. The soils data were obtained from Kern (2000), using methodology from Kern (1995) with corrected inconsistencies and gap filling from NRCS (1994).

The Vegetation/Ecosystem Modeling and Analysis Project (VEMAP) was a multi-institutional, international effort that addressed the response of biogeography and biogeochemistry to environmental variability in climate and other drivers in both space and time domains. The objectives of VEMAP were to study the intercomparison of biogeochemistry models and vegetationtype distribution models (biogeography models) and determine their sensitivity to changing climate, elevated atmospheric carbon dioxide concentrations, and other sources of altered forcing. Soil properties were based on a 10-km gridded EPA soil database developed by Kern (1994, 1995). Two soil coverages are provided in the Kern data set: one from the USDA...

The Vegetation/Ecosystem Modeling and Analysis Project (VEMAP) was a multi-institutional, international effort that addressed the response of biogeography and biogeochemistry to environmental variability in climate and other drivers in both space and time domains. The objectives of VEMAP were to study the intercomparison of biogeochemistry models and vegetationtype distribution models (biogeography models) and determine their sensitivity to changing climate, elevated atmospheric carbon dioxide concentrations, and other sources of altered forcing. Soil properties were based on a 10-km gridded EPA soil database developed by Kern (1994, 1995). Two soil coverages are provided in the Kern data set: one from the USDA...

This dataset respresents the soils with high volcanic content (pumice or volcanic glass) in the North Pacific Landscape Conservation Cooperative.
This dataset represents the soil water storage capacity (AWS in mm at 0.25 m depth) from SSURGO and STATSGO soil descriptions for soil map units in the state of southern Alaska that lie within the North Pacific Landscape Conservation Cooperative. Available Water Storage 0-25 cm - Weighted Average (centimeters). Available water storage (AWS). The volume of water that the soil, to a depth of 25 centimeters, can store that is available to plants. It is reported as the weighted average of all components in the map unit, and is expressed as centimeters of water. AWS is calculated from AWC (available water capacity) which is commonly estimated as the difference between the water contents at 1/10 or 1/3 bar (field capacity)...

This dataset represents the soil water storage capacity (AWS in mm at 0.5 m depth) from SSURGO and STATSGO soil descriptions for soil map units in the state of southern Alaska that lie within the North Pacific Landscape Conservation Cooperative. Available Water Storage 0-50 cm - Weighted Average (centimeters). Available water storage (AWS). The volume of water that the soil, to a depth of 50 centimeters, can store that is available to plants. It is reported as the weighted average of all components in the map unit, and is expressed as centimeters of water. AWS is calculated from AWC (available water capacity) which is commonly estimated as the difference between the water contents at 1/10 or 1/3 bar (field capacity)...
|

|
