Filters: Tags: streamflow (X) > Types: Citation (X) > partyWithName: U.S. Geological Survey (X)
47 results (47ms)|
Filters
Date Range
Extensions Types
Contacts
Categories Tag Types Tag Schemes
|
The basis for these features is U.S. Geological Survey Scientific Investigations Report 2017-5024 Flood Inundation Mapping Data for Johnson Creek near Sycamore, Oregon. The domain of the HEC-RAS hydraulic model is a 12.9-mile reach of Johnson Creek from just upstream of SE 174th Avenue in Portland, Oregon, to its confluence with the Willamette River. Some of the hydraulics used in the model were taken from Federal Emergency Management Agency, 2010, Flood Insurance Study, City of Portland, Oregon, Multnomah, Clackamas, and Washington Counties, Volume 1 of 3, November 26, 2010. The Digital Elevation Model (DEM) utilized for the project was developed from lidar data flown in 2015 and provided by the Oregon Department...
Types: Citation;
Tags: Johnson Creek,
Portland, Oregon,
Willamette Valley,
digital elevation models,
floods,
The basis for these features is U.S. Geological Survey Scientific Investigations Report 2017-5024 Flood Inundation Mapping Data for Johnson Creek near Sycamore, Oregon. The domain of the HEC-RAS hydraulic model is a 12.9-mile reach of Johnson Creek from just upstream of SE 174th Avenue in Portland, Oregon, to its confluence with the Willamette River. Some of the hydraulics used in the model were taken from Federal Emergency Management Agency, 2010, Flood Insurance Study, City of Portland, Oregon, Multnomah, Clackamas, and Washington Counties, Volume 1 of 3, November 26, 2010. The Digital Elevation Model (DEM) utilized for the project was developed from lidar data flown in 2015 and provided by the Oregon Department...
Categories: Data;
Types: Citation,
Downloadable,
Map Service,
OGC WFS Layer,
OGC WMS Layer,
Shapefile;
Tags: Johnson Creek,
Portland, Oregon,
Willamette Valley,
digital elevation models,
floods,
In 1991, the U.S. Geological Survey (USGS) began a study of more than 50 major river basins across the Nation as part of the National Water-Quality Assessment (NAWQA) project of the National Water-Quality Program. One of the major goals of the NAWQA project is to determine how water-quality conditions change over time. To support that goal, long-term consistent and comparable monitoring has been conducted on streams and rivers throughout the Nation. Outside of the NAWQA project, the USGS also has collected long-term water-quality data to support additional assessments of changing water-quality conditions. These data have been combined to provide insight into how natural features and human activities have contributed...
Categories: Data;
Types: Citation;
Tags: United States,
pesticides,
streamflow,
trends,
usgsnawqaswtrends,
This metadata record describes monthly input and output data covering the period 1900-2015 for a water-balance model described in McCabe and Wolock (2011). The input datasets are precipitation (PPT) and air temperature (TAV) from the PRISM group at Oregon State University. The model outputs include estimated potential evapotranspiration (PET), actual evapotranspiration (AET), runoff (RUN) (streamflow per unit area), soil moisture storage (STO), and snowfall (SNO). The datasets are arranged in tables of monthly total or average values measured in millimeters or degrees C and then multiplied by 100. The data are indexed by the identifier PRISMID, which refers to an ASCII raster of cells in an associated file named...
This data release contains inputs for and outputs from hydrologic simulations of the Apalachicola-Chattahoochee-Flint River Basin (ACFB) in the southeastern U.S. using the Precipitation Runoff Modeling System (PRMS). Seven hydrologic models, one coarse-resolution model for the entire ACFB and six fine-resolution models of tributary sub-basins. These simulations were developed to provide estimates of water availability and statistics of streamflow. These PRMS model input and output data are intended to accompany a U.S. Geological Survey Scientific Investigations Report (LaFontaine and others, 2017); they include three types of data: 1) PRMS input parameter and data files, 2) PRMS output data files, and 3) GIS files...
Our objective was to model minimum flow coefficient of variation (CV) on small, ungaged streams in the Upper Colorado River Basin. Modeling streamflows is an important tool for understanding landscape-scale drivers of flow and estimating flows where there are no gaged records. We focused our study in the Upper Colorado River Basin, a region that is not only critical for water resources but also projected to experience large future climate shifts toward a drier climate. We used a random forest modeling approach to model the relation between minimum flow CV (the standard deviation of annual minimum flows times 100 divided by the mean of annual minimum flows) on gaged streams (115 gages) and environmental variables....
Types: Citation;
Tags: Random forests,
Streamflow,
Streamflow modeling,
Ungaged streams,
Upper Colorado River Basin,
In 1991, the U.S. Geological Survey (USGS) began a study of more than 50 major river basins across the Nation as part of the National Water-Quality Assessment (NAWQA) project of the National Water-Quality Program. One of the major goals of the NAWQA project is to determine how water-quality conditions change over time. To support that goal, long-term consistent and comparable monitoring has been conducted on streams and rivers throughout the Nation. Outside of the NAWQA project, the USGS also has collected long-term water-quality data to support additional assessments of changing water-quality conditions. These data have been combined to provide insight into how natural features and human activities have contributed...
Categories: Data;
Types: Citation;
Tags: National Water Quality Program,
USGS Science Data Catalog (SDC),
United States,
Water Quality,
pesticides,
In August 2015, water velocities around a fully-loaded commercial barge tow were measured as the barge tow traveled upstream through the Chicago Sanitary and Ship Canal from a starting position in Lockport Pool, and passed through the Electric Dispersal Barrier System at river mile (RM) 296 near Romeoville, IL. Velocity measurements were made in and alongside the gap formed by the junction between the boxed stern of a rake hopper barge and the raked bow of a rake tanker barge (herein referred to as the rake-to-box junction gap) using two SonTek Argonaut SW 3kHz acoustic Doppler velocity meters (ADVM). One ADVM was mounted 0.091 meters below the water surface, facing downward in the center of the rake-to-box junction...
Categories: Data;
Types: Citation;
Tags: Chicago Sanitary and Ship Canal,
Illinois,
Lockport Locks,
Romeoville,
USGS Science Data Catalog (SDC),
A table is presented listing: (1) USGS Gage Station Numbers, (2) Model Identification Tags, (3) Model Term Estimates, (4) Model Term Fit Statistics, and (5) Model Performance Indices for Maximum Likelihood Logistic Regression (MLLR) Models estimating hydrological drought probabilities in the United States. Models were developed using streamflow daily values (DV) readily available from the U.S. Geological Survey National Water Information System (NWIS) and mean monthly streamflows readily computed from NWIS streamflow DV. Models were prepared for 9,144 sites throughout the United States as described in: Modeling Summer Month Hydrological Drought Probabilities In The United States Using Antecedent Flow Conditions...
Categories: Data;
Types: Citation;
Tags: Puerto Rico,
USGS Science Data Catalog (SDC),
United States of America,
decision support systems,
drought,
Our objective was to model mean annual number of zero-flow days (days per year) for small streams in the Upper Colorado River Basin under historic hydrologic conditions on small, ungaged streams in the Upper Colorado River Basin. Modeling streamflows is an important tool for understanding landscape-scale drivers of flow and estimating flows where there are no gaged records. We focused our study in the Upper Colorado River Basin, a region that is not only critical for water resources but also projected to experience large future climate shifts toward a drier climate. We used a random forest modeling approach to model the relation between zero-flow days per year on gaged streams (115 gages) and environmental variables....
Types: Citation;
Tags: Random forests,
Streamflow,
Streamflow modeling,
Ungaged streams,
Upper Colorado River Basin,
The basis for these features is U.S. Geological Survey Scientific Investigations Report 2017-5024 Flood Inundation Mapping Data for Johnson Creek near Sycamore, Oregon. The domain of the HEC-RAS hydraulic model is a 12.9-mile reach of Johnson Creek from just upstream of SE 174th Avenue in Portland, Oregon, to its confluence with the Willamette River. Some of the hydraulics used in the model were taken from Federal Emergency Management Agency, 2010, Flood Insurance Study, City of Portland, Oregon, Multnomah, Clackamas, and Washington Counties, Volume 1 of 3, November 26, 2010. The Digital Elevation Model (DEM) utilized for the project was developed from lidar data flown in 2015 and provided by the Oregon Department...
The basis for these features is U.S. Geological Survey Scientific Investigations Report 2017-5024 Flood Inundation Mapping Data for Johnson Creek near Sycamore, Oregon. The domain of the HEC-RAS hydraulic model is a 12.9-mile reach of Johnson Creek from just upstream of SE 174th Avenue in Portland, Oregon, to its confluence with the Willamette River. Some of the hydraulics used in the model were taken from Federal Emergency Management Agency, 2010, Flood Insurance Study, City of Portland, Oregon, Multnomah, Clackamas, and Washington Counties, Volume 1 of 3, November 26, 2010. The Digital Elevation Model (DEM) utilized for the project was developed from lidar data flown in 2015 and provided by the Oregon Department...
Types: Citation;
Tags: Johnson Creek,
Portland, Oregon,
Willamette Valley,
digital elevation models,
floods,
The Precipitation-Runoff Modeling System (PRMS) was used to produce simulations of streamflow for seven watersheds in eastern and central Montana for a baseline period (water years 1982-1999) and three future periods (water years 2021-2038, 2046–2063, and 2071-2038). The seven areas that were modeled are the O'Fallon, Redwater, Little Dry, Middle Musselshell, Judith, Cottonwood Creek, and Belt watersheds. Appendix 2 is provided as supplementary information to accompany the forthcoming journal article Potential Effects of Climate Change on Streamflow for Seven Watersheds in Eastern and Central Montana. These data document the monthly streamflow (in cubic meters per second) at the downstream end of each stream...
Categories: Data;
Types: Citation;
Tags: Great Plains,
Montana,
climate change,
effects of climate change,
fish,
The basis for these features is U.S. Geological Survey Scientific Investigations Report 2017-5024 Flood Inundation Mapping Data for Johnson Creek near Sycamore, Oregon. The domain of the HEC-RAS hydraulic model is a 12.9-mile reach of Johnson Creek from just upstream of SE 174th Avenue in Portland, Oregon, to its confluence with the Willamette River. Some of the hydraulics used in the model were taken from Federal Emergency Management Agency, 2010, Flood Insurance Study, City of Portland, Oregon, Multnomah, Clackamas, and Washington Counties, Volume 1 of 3, November 26, 2010. The Digital Elevation Model (DEM) utilized for the project was developed from lidar data flown in 2015 and provided by the Oregon Department...
Categories: Data;
Types: Citation,
Downloadable,
Map Service,
OGC WFS Layer,
OGC WMS Layer,
Shapefile;
Tags: Johnson Creek,
Portland, Oregon,
Willamette Valley,
digital elevation models,
floods,
The High Resolution National Hydrography Dataset Plus (NHDPlus HR) is an integrated datset of geospatial data layers, including the most current National Hydrography Dataset (NHD), the 10-meter 3D Elevation Program Digital Elevation Model (3DEP DEM), and the National Watershed Boundary Dataset (WBD). The NHDPlus HR combines the NHD, 3DEP DEMs, and WBD to create a stream network with linear referencing, feature naming, "value added attributes" (VAAs), elevation-derived catchments, and other features for hydrologic data analysis. The stream network with linear referencing is a system of data relationships applied to hydrographic systems so that one stream reach "flows" into another and "events" can be tied to and...
Types: Citation;
Tags: Administrative watershed units,
Area of Complex Channels,
Area to be submerged,
Basin,
Bay/Inlet,
The basis for these features is U.S. Geological Survey Scientific Investigations Report 2017-5024 Flood Inundation Mapping Data for Johnson Creek near Sycamore, Oregon. The domain of the HEC-RAS hydraulic model is a 12.9-mile reach of Johnson Creek from just upstream of SE 174th Avenue in Portland, Oregon, to its confluence with the Willamette River. Some of the hydraulics used in the model were taken from Federal Emergency Management Agency, 2010, Flood Insurance Study, City of Portland, Oregon, Multnomah, Clackamas, and Washington Counties, Volume 1 of 3, November 26, 2010. The Digital Elevation Model (DEM) utilized for the project was developed from lidar data flown in 2015 and provided by the Oregon Department...
Types: Citation;
Tags: Johnson Creek,
Portland, Oregon,
Willamette Valley,
digital elevation models,
floods,
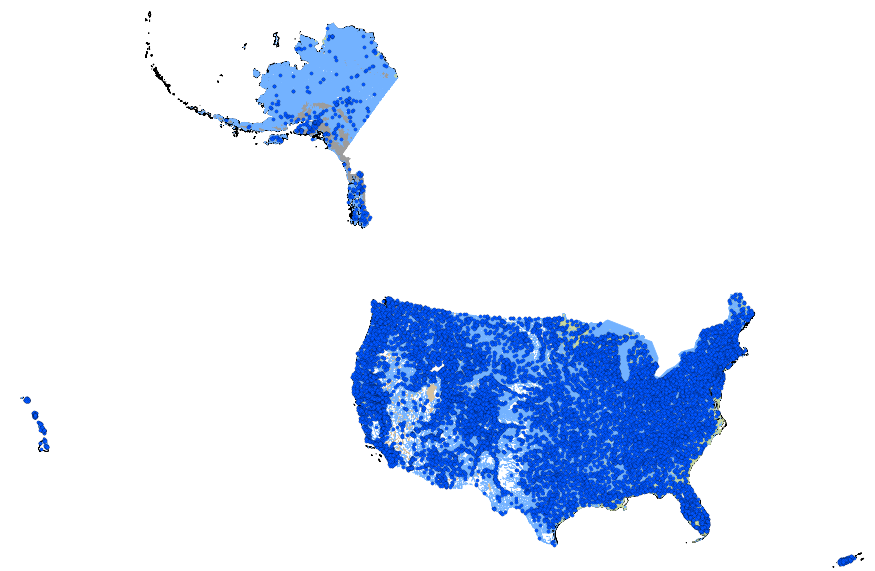
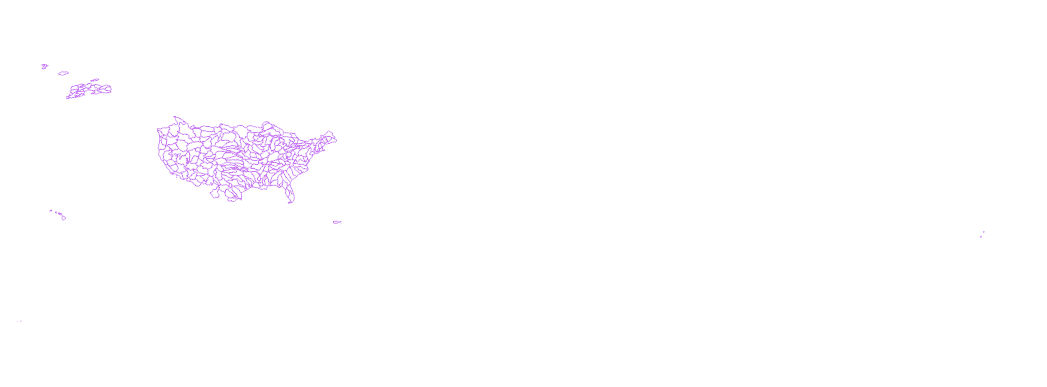
This geodatabase contains streams, waterbodies and wetlands, streamflow gaging stations, and coastlines for the United States, Puerto Rico, and the U.S. Virgin Islands. The streams are incorporated into a geometric network. All feature classes are vertically integrated with each other and with 1:1,000,000-scale transportation and boundary data sets.
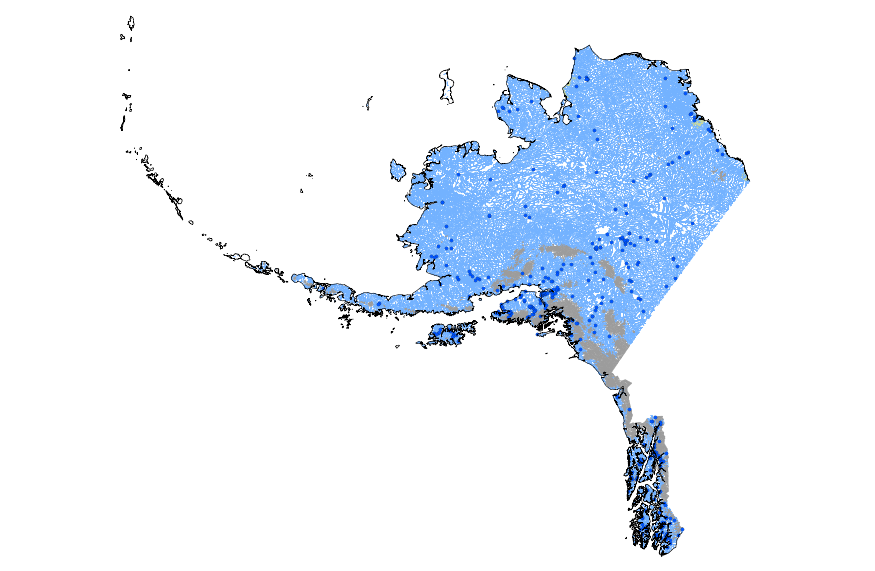
This geodatabase contains streams, waterbodies and wetlands, streamflow gaging stations, and coastlines for Alaska. The streams are incorporated into a geometric network. All feature classes are vertically integrated with each other and with 1:1,000,000-scale transportation and boundary data sets.
In 1991, the U.S. Geological Survey (USGS) began a study of more than 50 major river basins across the Nation as part of the National Water-Quality Assessment (NAWQA) project of the National Water-Quality Program. One of the major goals of the NAWQA project is to determine how water-quality conditions change over time. To support that goal, long-term consistent and comparable monitoring has been conducted on streams and rivers throughout the Nation. Outside of the NAWQA project, the USGS also has collected long-term water-quality data to support additional assessments of changing water-quality conditions. These data have been combined to provide insight into how natural features and human activities have contributed...
The National Water Quality Network (NWQN) for Rivers and Streams includes 113 surface-water river and stream sites monitored by the U.S. Geological Survey (USGS) National Water Quality Program, National Water-Quality Assessment (NAWQA) Project. The NWQN includes 19 large river coastal sites, 44 large river inland sites, 30 wadeable stream reference sites, 10 wadeable stream urban sites, and 10 wadeable stream agricultural sites. In addition to the 113 NWQN sites, 3 large inland river monitoring sites from the USGS Cooperative Water Program are also included in this annual water-quality reporting Web site to be consistent with previous USGS studies of nutrient transport in the Mississippi-Atchafalaya River Basin....
Categories: Data;
Types: Citation;
Tags: National Water Quality Program,
USGS Science Data Catalog (SDC),
United States,
Water Quality,
nutrient content,
|

|
