Filters: Tags: streamflow (X) > Types: Citation (X)
92 results (80ms)|
Filters
Date Range
Extensions Types
Contacts
Categories Tag Types
|
Streamflow is essential for maintaining healthy aquatic ecosystems and for supporting human water supply needs. Changes in climate, land use and water use practices may alter water availability. Understanding the potential effect of these changes on aquatic ecosystems is critical for long-term water management to maintain a balance between water for human consumption and ecosystem needs. Fish species data and streamflow estimates from a rainfall-runoff and flow routing model were used to develop boosted regression tree models to predict the relationship between streamflow and fish species richness (FSR) under plausible scenarios of (1) water withdrawal, (2) climate change and (3) increases in impervious surfaces...
Categories: Publication;
Types: Citation;
Tags: Aquatic,
Fish,
Landscapes,
Modeling,
Other Landscapes,
Estimated provisional streamflow values (Messinger and Burgholzer, 201x) for streamgages in the Rappahannock, Piankatank, and York River Basins and the shifted, expanded ratings that were used to develop them are included in this dataset. This file contains source data, daily streamflow records and selected ratings that had been saved in the National Water Information Service database for water years 1991-2013. Microsoft Excel formulas that were used to compute the estimated provisional streamflow (AltFlow) tables are included, and may be used to extend the AltFlow record following the procedure described by Messinger and Burgholzer (2017), in Appendix 2. This release also contains the existing AltFlow record for...
Categories: Data;
Types: Citation,
Map Service,
OGC WFS Layer,
OGC WMS Layer,
OGC WMS Service;
Tags: Piankatank River Basin,
Rappahannock River Basin,
Rating stability,
Stage-discharge relationship,
Streamflow,
In 2016, non-interpretive streamflow statistics were compiled for streamgages located throughout the Nation and stored in the StreamStatsDB database for use with StreamStats and other applications. Two previously published USGS computer programs that were designed to help calculate streamflow statistics were updated to better support StreamStats as part of this effort. These programs are named “GNWISQ” (Get National Water Information System Streamflow (Q) files) and “QSTATS” (Streamflow (Q) Statistics). Statistics for 20,438 streamgages that had 1 or more complete years of record during water years 1901 through 2015 were calculated from daily mean streamflow data; 19,415 of these streamgages were within the conterminous...
The study presented here utilized long-term streamflow records (over 500 years) to investigate the influence of interannual/interdecadal climate variability on the Colorado River basin. 19 unimpaired water year streamflow stations were reconstructed utilizing partial least square regression using standard tree ring chronologies. The spatial and temporal variability of drought was evaluated for all the stations for the different centuries in the record. Finally, the relationship between individual impact of ENSO, PDO, and AMO and its combined effect on streamflow was determined using the non parametric Rank Sum test for different lag years (0, +1, +2, and +3) of streamflow. This research also determined the change...
Categories: Publication;
Types: Citation,
Journal Citation;
Tags: AMO,
ENSO,
Journal of Hydrology,
PDO,
climate variability,
The Upper Green River represents a vital water supply for southwestern Wyoming and Upper/Lower Colorado River Compact states. Rapid development in the southwestern United States combined with the recent drought has greatly stressed the water supply of the Colorado River system, and concurrently increased the interest in long-term variations in streamflow. The current research developed six new tree-ring chronologies in and adjacent to the Upper Green River Basin (UGRB). Nine proxy reconstructions (three main-stem streams and six headwater streams) of UGRB streamflow were created by combining these new tree-ring chronologies with existing tree-ring chronologies from sites adjacent to the UGRB. All UGRB streamflow...
Categories: Publication;
Types: Citation,
Journal Citation;
Tags: Colorado River,
Droughts,
Journal of Hydrologic Engineering,
Reconstructions,
River basins,
The Precipitation-Runoff Modeling System (PRMS) was used to produce simulations of streamflow for seven watersheds in eastern and central Montana for a baseline period (water years 1982-1999) and three future periods (water years 2021-2038, 2046–2063, and 2071-2038). The seven areas that were modeled are the O'Fallon, Redwater, Little Dry, Middle Musselshell, Judith, Cottonwood Creek, and Belt watersheds. Appendix 2 is provided as supplementary information to accompany the forthcoming journal article Potential Effects of Climate Change on Streamflow for Seven Watersheds in Eastern and Central Montana. These data document the monthly streamflow (in cubic meters per second) at the downstream end of each stream...
Categories: Data;
Types: Citation;
Tags: Great Plains,
Montana,
climate change,
effects of climate change,
fish,
Streams across the world are highly fragmented due to the presence of in-stream barriers (e.g., dams and stream-road crossings), many of which restrict or block fish passage. Retrofitting or replacing these structures is a high priority for restoring habitat connectivity for native fishes and other aquatic organisms in the Pacific Northwest. The task of restoring habitat connectivity for problematic stream-road crossings is daunting given the many thousands of barriers that are present and the massive financial investments required. Further, the potential risks to road infrastructure from flooding, debris flows, and climate change will need to be addressed to ensure the best allocation of resources. In this study,...
Categories: Data,
Publication;
Types: Citation,
Map Service,
OGC WFS Layer,
OGC WMS Layer,
OGC WMS Service;
Tags: Climate Change,
Conservation Planning,
Decision Support,
Federal resource managers,
LCC Network Science Catalog,
Estimated provisional streamflow values (Messinger and Burgholzer, 2017) for streamgages in Ohio River Basin and the shifted, expanded ratings that were used to develop them are included in this dataset. This file contains source data, daily streamflow records and selected ratings that had been saved in the National Water Information Service database for water years 1991-2013. Microsoft Excel formulas that were used to compute the estimated provisional streamflow (AltFlow) tables are included, and may be used to extend the AltFlow record following the procedure described by Messinger and Burgholzer (2017), in Appendix 2. This release also contains the existing AltFlow record for the same streamgages in comma-separated...
Categories: Data;
Types: Citation;
Tags: New River Basin,
Ohio River Basin,
Rating stability,
Stage-discharge relationship,
Streamflow,
The basis for these features is U.S. Geological Survey Scientific Investigations Report 2017-5024 Flood Inundation Mapping Data for Johnson Creek near Sycamore, Oregon. The domain of the HEC-RAS hydraulic model is a 12.9-mile reach of Johnson Creek from just upstream of SE 174th Avenue in Portland, Oregon, to its confluence with the Willamette River. Some of the hydraulics used in the model were taken from Federal Emergency Management Agency, 2010, Flood Insurance Study, City of Portland, Oregon, Multnomah, Clackamas, and Washington Counties, Volume 1 of 3, November 26, 2010. The Digital Elevation Model (DEM) utilized for the project was developed from lidar data flown in 2015 and provided by the Oregon Department...
Categories: Data;
Types: Citation,
Downloadable,
Map Service,
OGC WFS Layer,
OGC WMS Layer,
Shapefile;
Tags: Johnson Creek,
Portland, Oregon,
Willamette Valley,
digital elevation models,
floods,
In the White River basin, water demand has increased with human development. Water development projects impact White River hydrology and sediment transport which can, in turn, affect resident Colorado pikeminnow populations. The objectives for this study were: 1) to compile historical biological, hydrological and physical data for the White River, 2) to analyze physical, chemical and biological features of the White River important to endangered fishes and, 3) to identify parameters for long-term monitoring to insure these features are maintained. We examined physical, chemical and biological characteristics during three development periods in the UCRB: early (1895-1945), middle (1946-1984) and post Taylor Draw...
Categories: Publication;
Types: Citation;
Tags: Colorado pikeminnow,
Kenney Reservoir,
Taylor Draw Dam,
White River,
habitat,
The hydrologic response units (HRUs) and stream segments available here are for an application of the Precipitation Runoff Modeling System (PRMS) in the southeastern United States by LaFontaine and others (2019). Geographic Information System (GIS) files for the HRUs and stream segments are provided as shapefiles with attribute hru_id_1 identifying the HRU numbering convention used in the PRMS model and seg_id_gcp identifying the stream segment numbering convention used in the PRMS model. This GIS files represent the watershed area for an approximately 1.16 million square kilometer area of the southeastern United States. A total of 20,251 HRUs and 10,742 stream segments are used in this modeling application. LaFontaine,...
A trend of increasing streamflow has been observed in the Mississippi River (MR) basin since the 1940 s as a result of increased precipitation. Herein we show that increasing MR flow is mainly in its baseflow as a result of land use change and accompanying agricultural activities that occurred in the MR basin during the last 60 years. Agricultural land use change in the MR basin has affected the basin-scale hydrology: more precipitation is being routed into streams as baseflow than stormflow since 1940 s. We explain that the conversion of perennial vegetation to seasonal row crops, especially soybeans, in the basin since 1940 s may have reduced evapotranspiration, increased groundwater recharge, and thus increased...
Categories: Publication;
Types: Citation;
Tags: Baseflow,
Data Visualization & Tools,
Land use change,
Landscapes,
Mississippi River,
Daily VEMAP output from the Hadley Coupled Climate Model (HadCM2) and land use projections from the Southeastern Michigan Council of Governments are used to examine the impacts of climate change and land use change on a regional watershed in southeastern lower Michigan. The precipitation, temperature, moisture, and solar radiation output from HadCM2 are processed before they are used as input to a modified version of the Biosphere-Atmosphere Transfer Scheme (BATS). The modified BATS model (BATS/HYDRO) includes the original 18 BATS land use types along with six new urban land classes as well as an improved surface runoff model, which accounts for impervious surfaces and depression storage. The daily VEMAP output...
Categories: Publication;
Types: Citation;
Tags: Climate change,
Data Visualization & Tools,
Great Lakes,
Landscapes,
Michigan,

The High Resolution National Hydrography Dataset Plus (NHDPlus HR) is an integrated datset of geospatial data layers, including the most current National Hydrography Dataset (NHD), the 10-meter 3D Elevation Program Digital Elevation Model (3DEP DEM), and the National Watershed Boundary Dataset (WBD). The NHDPlus HR combines the NHD, 3DEP DEMs, and WBD to create a stream network with linear referencing, feature naming, "value added attributes" (VAAs), elevation-derived catchments, and other features for hydrologic data analysis. The stream network with linear referencing is a system of data relationships applied to hydrographic systems so that one stream reach "flows" into another and "events" can be tied to and...
Types: Citation;
Tags: Administrative watershed units,
Area of Complex Channels,
Area to be submerged,
Basin,
Bay/Inlet,
This U.S. Geological Survey (USGS) data release provides daily reconstructed streamflows at 53 sites in selected subbasins in northern New Jersey and southeastern New York for water years 1922-2010; data and equations used to determine the reconstructed flows are included. These subbasins contain one or more surface-water diversions that are currently operated or have been operated in the past by water purveyors or the New Jersey Department of Environmental Protection (NJDEP). The streams include the Passaic and Hackensack Rivers and some adjacent streams. Reconstructed streamflows are estimates of those streamflows that would have occurred without the effects of changes in reservoir storage or surface-water diversions...
Types: Citation;
Tags: Hackensack River Basin,
New Jersey,
New York,
Passaic River Basin,
Reconstructed flows,
The development and the generation of the datasets that are published through this data release, were based on the results and findings of the report mentioned here: Kim, M.H., 2018, Flood-inundation maps for the Wabash River at Lafayette, Indiana: U.S. Geological Survey Scientific Investigations Report 2018–5017, 10 p., https://doi.org/10.3133/sir20185017. The geospatial dataset contain final versions of the raster and vector geospatial data and its related metadata, and the model archive dataset contains all relevant files to document and re-run the surface-water (SW) hydraulic model that are discussed in the report.
The basis for these features is U.S. Geological Survey Scientific Investigations Report 2017-5024 Flood Inundation Mapping Data for Johnson Creek near Sycamore, Oregon. The domain of the HEC-RAS hydraulic model is a 12.9-mile reach of Johnson Creek from just upstream of SE 174th Avenue in Portland, Oregon, to its confluence with the Willamette River. Some of the hydraulics used in the model were taken from Federal Emergency Management Agency, 2010, Flood Insurance Study, City of Portland, Oregon, Multnomah, Clackamas, and Washington Counties, Volume 1 of 3, November 26, 2010. The Digital Elevation Model (DEM) utilized for the project was developed from lidar data flown in 2015 and provided by the Oregon Department...
Types: Citation;
Tags: Johnson Creek,
Portland, Oregon,
Willamette Valley,
digital elevation models,
floods,
The Apalachicola-Chattahoochee-Flint River Basin (ACFB) was modeled to produce fourteen simulations of streamflow with the Precipitation Runoff Modeling System (PRMS); seven simulations without water use effects and seven simulations with water use effects. The simulations were for 1) the whole ACFB basin (1982-2012), 2) the Chestatee River sub-basin (1982-2012), 3) the Chipola River sub-basin (1982-2012), 4) the Ichawaynochaway Creek sub-basin (1982-2012), 5) the Potato Creek sub-basin (1942-2012), 6) the Spring Creek sub-basin (1952-2012), and 7) the upper Chattahoochee River sub-basin (1982-2012). These data document the PRMS parameter files and input data files used in each of these simulations. Input files...
Types: Citation;
Tags: Apalachicola River,
Chattahoochee River,
Chestatee River,
Chipola River,
Flint River,
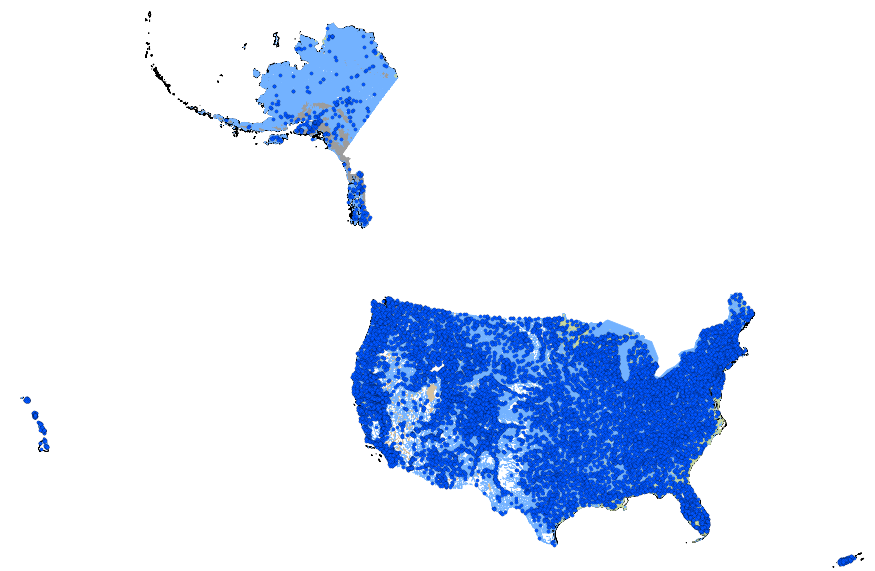
This geodatabase contains streams, waterbodies and wetlands, streamflow gaging stations, and coastlines for the United States, Puerto Rico, and the U.S. Virgin Islands. The streams are incorporated into a geometric network. All feature classes are vertically integrated with each other and with 1:1,000,000-scale transportation and boundary data sets.
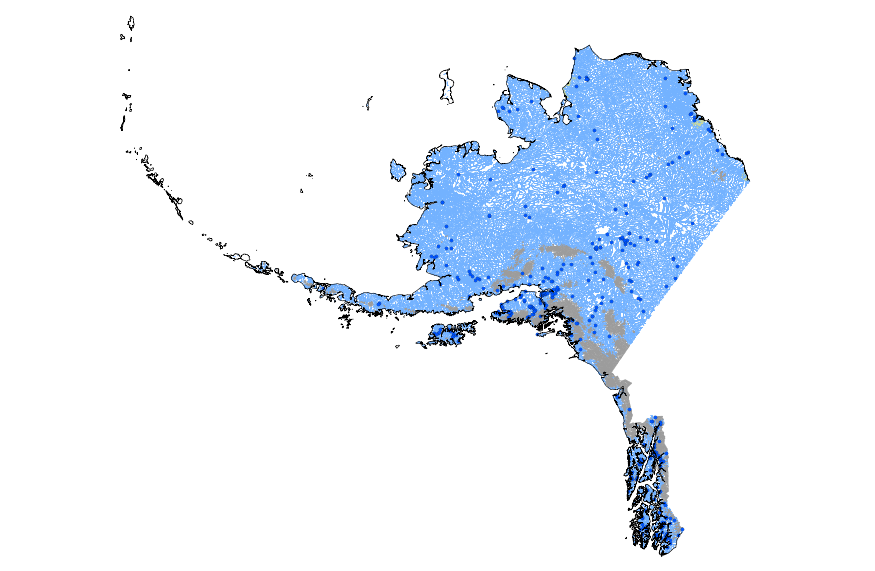
This geodatabase contains streams, waterbodies and wetlands, streamflow gaging stations, and coastlines for Alaska. The streams are incorporated into a geometric network. All feature classes are vertically integrated with each other and with 1:1,000,000-scale transportation and boundary data sets.
|

|
