Filters: Tags: threat (X) > partyWithName: TNC GIS Staff (X)
13 results (29ms)|
Filters
Date Range
Tag Schemes |

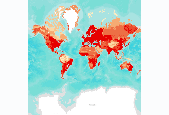
Change in nitrogen flow to the coast since pre-industrial times, by marine ecoregion. The map shows the estimated change in coastal discharge of dissolved inorganic nitrogen (DIN) between preindustrial and contemporary times by marine ecoregion. We calculated this change using data from Green et al. (2005), which was developed using land surface runoff models that included agriculture, livestock, human sewage, and atmospheric deposition sources of DIN. The original spatial data set assigned discharge values to coastal pixels, and we summed the value of pixels within each ecoregion for each time period. We then calculated ecoregional values by subtracting preindustrial sums from contemporary values. These data...

Accessibility of natural habitats to humans, by terrestrial ecoregion. The human accessibility map provides an index of the level of effort it would take for a human on foot to access any given square kilometer of nonconverted land from existing infrastructure. We calculated human accessibility from a one-square-kilometer spatial grid of the terrestrial world consisting of a cost surface where the value of each cell was derived from topographic slope, vegetation type, and vegetation density. We developed a second matching spatial grid of infrastructure, depicting roads, railroads, navigable rivers, cities, and towns. Then we calculated a least cost path from each noninfrastructure grid cell to infrastructure grid...

Proportion of coral bleaching events that were high impact, by marine ecoregion. Data on coral bleaching is derived from ReefBase and represents bleaching from a single year (1998). This was the worst bleaching event on record, linked to an El Niño year. It was also very well monitored, partly because of its unprecedented nature. Bleaching has remained widespread since that time in locations around the world. The data was generously provided by Jamie Oliver from a subset that was prepared for another publication (Oliver et al. 2008), and we have only made minor corrections to errors for the Seychelles in this data set. Bleaching reports in ReefBase were derived from a broad range of sources, but each has been assigned...

Number of harmful species that have invaded freshwater habitats, by freshwater ecoregion. The occurrence and ecological impact for freshwater invasive species were compiled in a geographically referenced database according to the methods of Molnar et al. (2008). Information about 550 species was systematically collected from a wide variety of global, regional, national, and subnational data sources. Non-native distributions were documented by freshwater ecoregion. The threat of each species to native biodiversity was scored using the following categories: 4, disrupts entire ecosystem processes with wider abiotic influences; 3, disrupts multiple species, some wider ecosystem function, and/or keystone species or...

Percent of ecoregion area that is arable and not yet converted. We developed the map of arable land not yet converted to agriculture from data provided by Fischer et al. (2002). Our map was produced by modeling the moderate- to high-yielding climate-soil envelopes for nine major world crops and projecting those areas geographically in regions that are not classified as urban or agricultural by JRC (2003). It represented rain-fed agriculture only, so the area of arable land is likely underestimated. It also does not account for changing future demands for irrigated agriculture that are driven by national policy and finance. These data were derived by The Nature Conservancy, and were displayed in a map published...

Percent of each terrestrial ecoregion's natural habitat that has been converted by humans. The data on the amount of habitat lost was derived from the Global Land Cover 2000 (JRC 2003), which is based on satellite imagery; the Global Rural-Urban Mapping Project (CIESIN et al. 2004); and a global coverage of roads and railroads compiled from ESRI Digital Chart of the World. While the data tell us how much land has been converted from a natural state to a human-altered state for 2000, it does not tell us about any specific type of habitat that has been lost, what it was converted to, how long ago it was converted, or the extent to which the human land use still supports some biodiversity. Because the satellite-derived...

The condition of natural fire systems, by terrestrial ecoregion. Spatial data on the status and trends of fire regimes were developed under the Global Fire Partnership, a collaboration of nongovernment and academic institutions and summarized in Shlisky et al. (2007). The fire regime and its status and trends were established through a formal expert workshop process. Workshops were held around the world from 2004 to 2006. These data were displayed in a map published in The Atlas of Global Conservation (Hoekstra et al., University of California Press, 2010). More information at http://nature.org/atlas.

The average percent of forest cleared per year between 2000 – 2005, by terrestrial ecoregion. The map of forest clearing was produced using Vegetation Continuous Field (VCF) data (Hansen et al. 2006). VCF files were assembled by year for 2000 through 2005 by realm. These data sets were resampled to one-kilometer ground resolution and merged into a global product by year. We then subtracted data from 2001 from 2000 data; this process was applied to all subsequent years. The derived, differenced data sets were averaged to obtain an annual av¬erage for years 2000–2005. These data were derived by The Nature Conservancy, and were displayed in a map published in The Atlas of Global Conservation (Hoekstra et al., University...

Number of harmful species that have invaded marine habitats, by marine ecoregion. The occurrence and ecological impact of marine invasive species were compiled in a geographically referenced database by Molnar et al. (2008). Information about 329 species was systematically collected from a wide variety of global, regional, national, and subnational data sources. Non-native distributions were documented by marine ecoregion. The threat of each species to native biodiversity was scored using the following categories: 4, disrupts entire ecosystem processes with wider abiotic influences; 3, disrupts multiple species, some wider ecosystem function, and/or keystone species or species of high conservation value (e.g.,...

Percent of coral reefs at risk, by marine ecoregion. The original Reefs at Risk indicator was devised by Bryant et al. (1998) with considerable expert consultation and utilized multiple global data layers to develop separate threat layers measuring coastal development, marine-based pollution, overexploitation and destructive fishing, and inland pollution and erosion. There are areas where particular elements of the model were not as effective, but it has proved a valuable generic tool that has led to further regional studies for Southeast Asia and for the Caribbean that followed the same basic principles, with only minor amendments to the model. Bryant et al. (1998) used the combined threat layers to derive a...
Magnitude of habitat fragmentation indicated by largest patch size, by terrestrial ecoregion. We considered agriculture, urban infrastructure, roads, and railroads as “fragmenting” features to the landscape and areas not converted to agriculture, urban infrastructure, roads, or railroads as “nonfragmented” terrestrial landscape patches. We used input spatial data from JRC’s GLC 2000 (2003), CIESIN et al. (2004), Defense Mapping Agency (1992), and South American Conservation Region (2005). To produce the data, we constructed a global map grid of fragmenting features (Mollweide projection, based on the WGS 1984 datum; 1 km2 resolution); this grid was then combined with the GLC 2000, adding a new “fragmenting features”...

Percent of coastline densely populated, by marine ecoregion. The map shows the proportion of coastline (from the shore to within five kilometers of the coast) in each ecoregion where there are more than five hundred persons per square kilometer. By focusing attention on a narrow coastal strip, we believe that we are capturing areas with the highest likelihood of significant losses of intertidal and adjacent habitats as a result of building, dredging, land reclamation, and other forms of coastal engineering. It does not, of course, measure areas of coastal development per se and does not capture areas where aquaculture, agriculture, or low-density tourism have impacts. These data were derived by The Nature Conservancy,...

Degree of disruption of fish runs, by freshwater ecoregion. The level of disruption of fish runs was determined by Reidy-Liermann, C. A., C. Nilsson, J. Robertson, and R. Ng (unpublished) by calculating the average proportion of undammed distance among the longest connected freshwater pathways (including lakes) in each ecoregion, regardless of stream order. This metric considered only the five longest water courses or river segments between or without dams. Depending on the confidence in the underlying dam and reservoir data, ecoregions without known dams may have been deemed either as fully free-flowing or as having insufficient data. When dams data were deemed unreliable for a river, those dams were excluded...
|

|
