Filters: Tags: usfs (X) > partyWithName: Conservation Biology Institute (X)
373 results (42ms)|
Filters
Date Range
Extensions Contacts
Categories Tag Types
|

The Standardized Precipitation Index (SPI) is a probability index that can be calculated for different time periods to indicate periods of abnormal wetness or dryness. SPI is derived solely from monthly precipitation and can be compared across regions with different climates. The SPI is an index based on the probability of recording a given amount of precipitation, and the probabilities are standardized so that an index of zero indicates the median precipitation amount (half of the historical precipitation amounts are below the median, and half are above the median). This dataset shows the average 12-month SPI (in classes ranging from extremely wet to extremely dry) for the three-month forecast period indentified...

This dataset shows the predicted area of high fire potential for the current year up to the end of the forecast period as simulated by a modified version of the MC1 Dynamic General Vegetation Model (DGVM). The area of high fire potential is where PDSI and MC1-calculated values of potential fire behavior (fireline intensity for forest and shrubland and rate of spread of spread for grassland) exceed calibrated threshold values. Potential fire behavior in MC1 is estimated using National Fire Danger Rating System (NFDRS) formulas, monthly climatic (temperature, precipitation, and relative humidity) data, and fuel moisture and loading estimates. Monthly climatic data includes recorded values up to the last observed...
The Institute for Bird Populations (IBP) coordinates the Monitoring Avian Productivity and Survivorship (MAPS) Program to assess and monitor the vital rates and population dynamics of North American landbirds. The MAPS Program utilizes a standardized constant-effort mist netting and banding protocol (DeSante et al. 2010) at a continent-wide network of monitoring stations. Each summer dedicated volunteers operate bird-banding stations to collect data on individual "birds-in-the-hand" representing over 200 species. Analyses of MAPS data provide critical information relating to the ecology, conservation, and management of North American landbird populations and the factors responsible for changes in their populations....

The MAPSS team together with long-time collaborator Chris Daly of the Spatial Climate Analysis Service is using Daly's PRISM model to produce high-resolution data grids of observed fire weather. The PRISM model produces interpolations of weather station data that are sensitive to topography, which is especially important in the complex, fire-prone terrain of the mountainous West. Input station data are gathered primarily from the National Weather Service (NWS) Cooperative Observer Program (COOP) and U.S. Department of Agriculture-Natural Resources Conservation Service (USDA-NRCS) SNOTEL networks. For mapped examples of the PRISM-generated historical weather data grids see the Spatial Climate Analysis Service's Web...

A map service on the www depicting ownership parcels of the surface estate. Each surface ownership parcel is tied to a particular legal transaction. The same individual or organization may currently own many parcels that may or may not have been acquired through the same legal transaction. Therefore, they are captured as separate entities rather than merged together. Surface Ownership provides the land status user with a current snapshot of ownership within National Forest boundaries. The purpose of the data is to provide display, identification, and analysis tools for determining current boundary information for Forest Service managers, GIS Specialists, and others. Map service is symbolized showing US Forest Service...

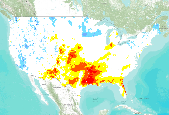
This map shows the predicted area of high fire potential for the current year up to the end of the forecast period as simulated by a modified version of the MC1 Dynamic General Vegetation Model (DGVM). Different colors indicate the level of consensus among five different MC1 simulations (i.e., one for each forecast provided by five different weather models), ranging from one of five to five of five simulations predicting high fire potential. The area of high fire potential is where PDSI and MC1-calculated values of potential fire behavior (fireline intensity for forest and shrubland and rate of spread of spread for grassland) exceed calibrated threshold values. Potential fire behavior in MC1 is estimated using...

The Palmer Drought Severity Index (PDSI) is a measure of drought derived from both precipitation and temperature. Negative (i.e., dry) values of PDSI are closely associated with a high potential for wildland fire. PDSI is based on a supply-and-demand model of soil moisture originally developed by Wayne Palmer, who published his method in the 1965 paper Meteorological Drought for the Office of Climatology of the U.S. Weather Bureau.The index has proven to be most effective in indicating long-term drought (or wetness) over a matter of several months. PDSI calculations are standardized for an individual station (or grid cell) based on the long-term variability of precipitation and temperature at that location....

The Palmer Drought Severity Index (PDSI) is a measure of drought derived from both precipitation and temperature. Negative (i.e., dry) values of PDSI are closely associated with a high potential for wildland fire. PDSI is based on a supply-and-demand model of soil moisture originally developed by Wayne Palmer, who published his method in the 1965 paper Meteorological Drought for the Office of Climatology of the U.S. Weather Bureau.The index has proven to be most effective in indicating long-term drought (or wetness) over a matter of several months. PDSI calculations are standardized for an individual station (or grid cell) based on the long-term variability of precipitation and temperature at that location....

This map shows the predicted area of high fire potential for the current year up to the end of the forecast period as simulated by a modified version of the MC1 Dynamic General Vegetation Model (DGVM). Different colors indicate the level of consensus among five different MC1 simulations (i.e., one for each forecast provided by five different weather models), ranging from one of five to five of five simulations predicting high fire potential. The area of high fire potential is where PDSI and MC1-calculated values of potential fire behavior (fireline intensity for forest and shrubland and rate of spread of spread for grassland) exceed calibrated threshold values. Potential fire behavior in MC1 is estimated using...

The Palmer Drought Severity Index (PDSI) is a measure of drought derived from both precipitation and temperature. Negative (i.e., dry) values of PDSI are closely associated with a high potential for wildland fire. PDSI is based on a supply-and-demand model of soil moisture originally developed by Wayne Palmer, who published his method in the 1965 paper Meteorological Drought for the Office of Climatology of the U.S. Weather Bureau.The index has proven to be most effective in indicating long-term drought (or wetness) over a matter of several months. PDSI calculations are standardized for an individual station (or grid cell) based on the long-term variability of precipitation and temperature at that location....

This dataset shows the predicted area of high fire potential for the current year up to the end of the forecast period as simulated by a modified version of the MC1 Dynamic General Vegetation Model (DGVM). The area of high fire potential is where PDSI and MC1-calculated values of potential fire behavior (fireline intensity for forest and shrubland and rate of spread of spread for grassland) exceed calibrated threshold values. Potential fire behavior in MC1 is estimated using National Fire Danger Rating System (NFDRS) formulas, monthly climatic (temperature, precipitation, and relative humidity) data, and fuel moisture and loading estimates. Monthly climatic data includes recorded values up to the last observed...

A map service on the www depicting status of parcels for Forest Service land congressionally designated as wilderness such as National Wilderness Areas. This map service provides display, identification, and analysis tools for determining current boundary information for Forest Service managers, GIS Specialists, and others. Best available source with a target scale of 1:24000 for Continental U.S., Puerto Rico, and Hawaii and 1:63360 for Alaska.

Created by Congress in 1964, the Land and Water Conservation Fund (LWCF) provides money to federal, state and local governments to purchase land, water and wetlands for the the benefit of all Americans. From majestic forests and snowcapped mountains, to wild rivers and stunning beaches, these acquisitions become part of your national forests. For more information visit the LWCF website: http://www.fs.fed.us/land/staff/LWCF/
The MAPSS team together with long-time collaborator Chris Daly of the Spatial Climate Analysis Service is using Daly's PRISM model to produce high-resolution data grids of observed fire weather. The PRISM model produces interpolations of weather station data that are sensitive to topography, which is especially important in the complex, fire-prone terrain of the mountainous West. Input station data are gathered primarily from the National Weather Service (NWS) Cooperative Observer Program (COOP) and U.S. Department of Agriculture-Natural Resources Conservation Service (USDA-NRCS) SNOTEL networks. For mapped examples of the PRISM-generated historical weather data grids see the Spatial Climate Analysis Service's Web...

The Palmer Drought Severity Index (PDSI) is a measure of drought derived from both precipitation and temperature. Negative (i.e., dry) values of PDSI are closely associated with a high potential for wildland fire. PDSI is based on a supply-and-demand model of soil moisture originally developed by Wayne Palmer, who published his method in the 1965 paper Meteorological Drought for the Office of Climatology of the U.S. Weather Bureau.The index has proven to be most effective in indicating long-term drought (or wetness) over a matter of several months. PDSI calculations are standardized for an individual station (or grid cell) based on the long-term variability of precipitation and temperature at that location....

The Standardized Precipitation Index (SPI) is a probability index that can be calculated for different time periods to indicate periods of abnormal wetness or dryness. SPI is derived solely from monthly precipitation and can be compared across regions with different climates. The SPI is an index based on the probability of recording a given amount of precipitation, and the probabilities are standardized so that an index of zero indicates the median precipitation amount (half of the historical precipitation amounts are below the median, and half are above the median). This dataset shows the average 12-month SPI (in classes ranging from extremely wet to extremely dry) for the three-month forecast period indentified...

The Standardized Precipitation Index (SPI) is a probability index that can be calculated for different time periods to indicate periods of abnormal wetness or dryness. SPI is derived solely from monthly precipitation and can be compared across regions with different climates. The SPI is an index based on the probability of recording a given amount of precipitation, and the probabilities are standardized so that an index of zero indicates the median precipitation amount (half of the historical precipitation amounts are below the median, and half are above the median). This dataset shows the average 12-month SPI (in classes ranging from extremely wet to extremely dry) for the three-month forecast period indentified...

The Standardized Precipitation Index (SPI) is a probability index that can be calculated for different time periods to indicate periods of abnormal wetness or dryness. SPI is derived solely from monthly precipitation and can be compared across regions with different climates. The SPI is an index based on the probability of recording a given amount of precipitation, and the probabilities are standardized so that an index of zero indicates the median precipitation amount (half of the historical precipitation amounts are below the median, and half are above the median). This dataset shows the average 12-month SPI (in classes ranging from extremely wet to extremely dry) for the three-month forecast period indentified...

The Rapid Assessment (RA) vegetation dynamics data help to synthesize the best available knowledge of vegetation dynamics and quantify the natural range of variability in vegetation composition and structure. Models consist of two components: (1) a comprehensive description and (2) a quantitative, state-and-transition (box) model, created in the public domain software VDDT (Vegetation Dynamics Development Tool; Beukema et al. 2003). RA vegetation models were based on a simple, standardized five-box model that combines three generic succession stages with two canopy cover classes. Each class is specifically defined for individual models. Variations on this standardized model were also developed. Models were developed...

This dataset shows the predicted area of high fire potential for the current year up to the end of the forecast period as simulated by a modified version of the MC1 Dynamic General Vegetation Model (DGVM). The area of high fire potential is where PDSI and MC1-calculated values of potential fire behavior (fireline intensity for forest and shrubland and rate of spread of spread for grassland) exceed calibrated threshold values. Potential fire behavior in MC1 is estimated using National Fire Danger Rating System (NFDRS) formulas, monthly climatic (temperature, precipitation, and relative humidity) data, and fuel moisture and loading estimates. Monthly climatic data includes recorded values up to the last observed...
|

|
