Filters: Tags: water table (X)
63 results (21ms)|
Filters
Date Range
Extensions Types
Contacts
Categories Tag Types
|
Groundwater–surface water interaction in the riparian zone of an incised channel, Walnut Creek, Iowa
Summary Riparian zones of many incised channels in agricultural regions are cropped to the channel edge leaving them unvegetated for large portions of the year. In this study we evaluated surface and groundwater interaction in the riparian zone of an incised stream during a spring high flow period using detailed stream stage and hydraulic head data from six wells, and water quality sampling to determine whether the riparian zone can be a source of nitrate pollution to streams. Study results indicated that bank storage of stream water from Walnut Creek during a large storm water runoff event was limited to a narrow 1.6 m zone immediately adjacent to the channel. Nitrate concentrations in riparian groundwater were...
Categories: Publication;
Types: Citation;
Tags: Bank storage,
Data Visualization & Tools,
Floodplain,
Incised channel,
Landscapes,
The depths to a high and average water table below the land surface were estimated across the Clover Creek watershed in Pierce County, Washington. Groundwater model simulations provided initial estimates of water-table depths for the analysis. To provide optimized, data-driven estimates of these depths, a continuous bias correction surface was applied to model output according to differences between simulated and observed water levels at observation wells.
Categories: Data;
Types: Downloadable,
GeoTIFF,
Map Service,
OGC WFS Layer,
OGC WMS Layer,
Raster,
Shapefile;
Tags: Clover Creek watershed,
Groundwater Model,
Hydrology,
Pierce County,
USGS Science Data Catalog (SDC),
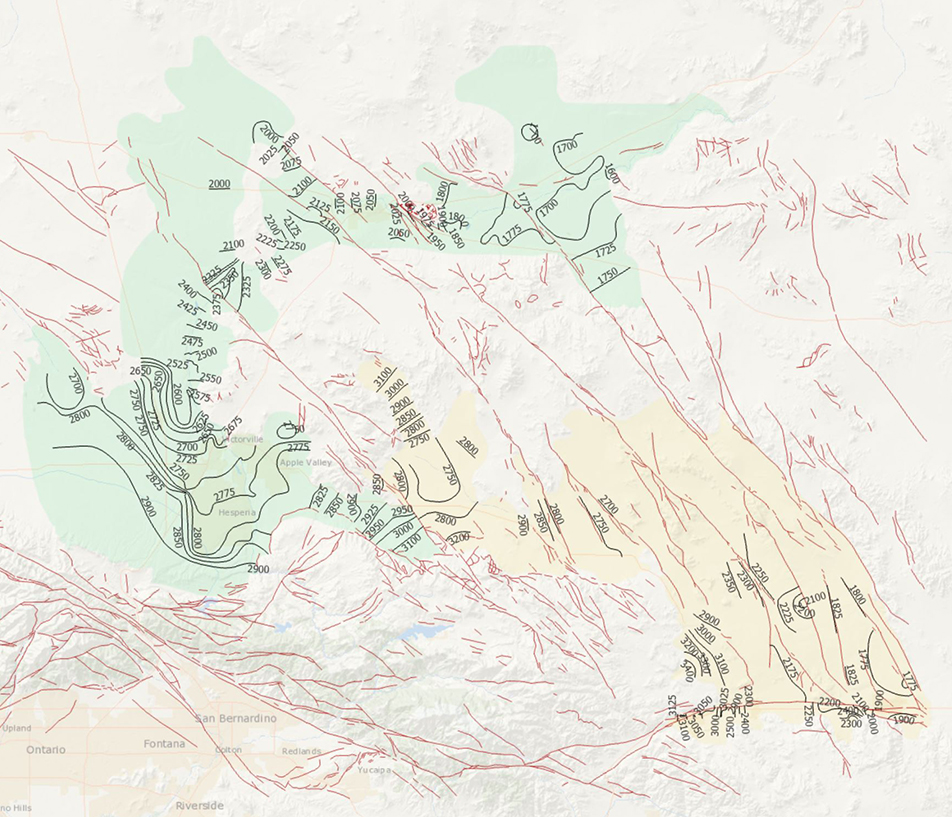
During 2014, the U.S. Geological Survey and other agencies made approximately 1,026 water-level measurements in the Mojave River and Morongo groundwater basins. These data document recent conditions and, when compared with previous data, changes in groundwater levels. A water-level contour map was drawn using data from about 610 wells, providing coverage for most of the basins. Twenty-four hydrographs show long-term (1930-2014) water-level conditions throughout the basins, and 9 short-term (1992 to 2014) hydrographs show the effects of recharge and discharge along the Mojave River. In addition, a water-level-change map was compiled to compare was compiled to compare the 2014 water levels to the 2012 water levels...
Categories: Data Release - Revised;
Tags: USGS,
USGS Science Data Catalog (SDC),
contours,
drainage basin,
ground water,

These data were released prior to the October 1, 2016 effective date for the USGS’s policy dictating the review, approval, and release of scientific data as referenced in USGS Survey Manual Chapter 502.8 Fundamental Science Practices: Review and Approval of Scientific Data for Release. The USGS compiles online access to water-resources data collected at approximately 1.5 million sites in all 50 States, the District of Columbia, Puerto Rico, the Virgin Islands, Guam, American Samoa and the Commonwealth of the Northern Mariana Islands.

These data were released prior to the October 1, 2016 effective date for the USGS’s policy dictating the review, approval, and release of scientific data as referenced in USGS Survey Manual Chapter 502.8 Fundamental Science Practices: Review and Approval of Scientific Data for Release. The U.S. Geological Survey's National Water-Use Information Program is responsible for compiling and disseminating the nation's water-use data. The USGS works in cooperation with local, State, and Federal environmental agencies to collect water-use information. USGS compiles these data to produce water-use information aggregated at the county, state, and national levels. Every five years, data at the county level are compiled into...
This dataset consists of contours showing the generalized altitude of the potentiometric surface for the shallow groundwater system in the Lower Gunnison River Basin in Delta, Montrose, Ouray, and Gunnison Counties, Colorado. Potentiometric-surface altitude was contoured from values in the raster dataset potalt. The U.S. Geological Survey prepared this dataset in cooperation with the Colorado Water Conservation Board.
Categories: Data;
Types: Downloadable,
Map Service,
OGC WFS Layer,
OGC WMS Layer,
Shapefile;
Tags: Colorado,
Delta,
Gunnison,
Montrose,
Ouray,
Water table depth is known to play an important role in nitrogen cycling in riparian zones, but little detailed monitoring of water table fluctuations has been reported. In this study, results of high-resolution water table monitoring under three common riparian land covers (forest, cool season grass, corn) were analysed to gain a better understanding of the relation of vegetation cover to water table depth. Three riparian wells located at the Neal Smith National Wildlife Refuge in Jasper County, Iowa, were instrumented with data loggers to record hourly water table behaviour from July to December 2004. Water table depth under the forest showed a diurnal pattern of rising and falling water levels, whereas the grass...
Categories: Publication;
Types: Citation;
Tags: Data Visualization & Tools,
Landscapes,
Northeast CASC,
Other Landscapes,
Science Tools For Managers,
This dataset is the raster, in feet, of the potentiometric-surface map, spring 2020, Mississippi River Valley alluvial aquifer (MRVA). The raster cell size is 1,000 meters; the raster altitude data was referenced to the North American Vertical Datum of 1988 (NAVD 88). The raster was interpolated using (1) most of the available groundwater-altitude (GWA) data from wells and surface-water-altitude (SWA) data from streamgages, and (2) potentiometric-surface contours.
This data release contains five comma separated value (csv) files that describe the location and water-quality data for wells, springs, and streams compiled for the U.S. Geological Survey (USGS) and Oregon Water Resources Department (OWRD) investigation of the groundwater resources of the Harney Basin, Oregon. The data included are site IDs, various site location information, well-construction details and hydrostratigraphy, monitoring status, spring elevation, summarized historic spring discharge, date of each spring discharge measurement, source of the discharge measurement, and results of geochemical analyses for sites sampled as part of the associated USGS Scientific Investigations Report. Some of the data presented...
Categories: Data;
Tags: Blue Mountains,
Crane,
Dog Mountain,
Donner und Blitzen River,
Harney County,

These data were released prior to the October 1, 2016 effective date for the USGS’s policy dictating the review, approval, and release of scientific data as referenced in USGS Survey Manual Chapter 502.8 Fundamental Science Practices: Review and Approval of Scientific Data for Release. The Mojave River and Morongo ground-water basins are in the southwestern part of the Mojave Desert in southern California. Ground water from these basins supplies a major part of the water requirements for the region. The continuous population growth in this area has resulted in ever-increasing demands on local ground-water resources. The collection and interpretation of ground-water data helps local water districts, military bases,...
Question: What are the drivers of bryophyte succession in paludifying boreal Picea mariana forests? Location: The Clay-Belt of Quebec and Ontario, Canada. Methods: The bryophyte community and habitat variables (forest floor thickness, water table, stand density, canopy openness micro-climate and presence of ericaceous species) were analysed in a chronosequence of 13 stands from 50 to more than 350 years since fire. Results: Across the chronosequence, feathermosses were replaced by shade and desiccation tolerant slower growing hummock Sphagna and then by faster growing hollow Sphagna. These changes were linked with both increasing light availability and the movement of the water table into the forest floor. Conclusions:...
Categories: Publication;
Types: Citation,
Journal Citation;
Tags: Black spruce,
Clay Belt,
Feathermoss,
Habitat variables,
Journal of Vegetation Science,
The U.S. Geological Survey (USGS) is providing online maps of water-table and potentiometric-surface altitude in the upper glacial, Magothy, Jameco, Lloyd, and North Shore aquifers on Long Island, New York, April–May 2016. Also provided is a depth-to-water map for Long Island, New York, April–May 2016. The USGS makes these maps and geospatial data available as REST Open Map Services (as well as HTTP, JSON, KML, and shapefile), so end-users can consume them on mobile and web clients. A companion report, U.S. Geological Survey Scientific Investigations Map 3398 (Como and others, 2018; https://doi.org/10.3133/sim3398) further describes data collection and map preparation and presents 68x22 in. Portable Document...
Categories: Data;
Types: ArcGIS REST Map Service,
ArcGIS Service Definition,
Citation,
Downloadable,
Map Service;
Tags: Groundwater,
Hydrology,
Levels,
Long Island,
Magothy Aquifer,

These data were released prior to the October 1, 2016 effective date for the USGS’s policy dictating the review, approval, and release of scientific data as referenced in USGS Survey Manual Chapter 502.8 Fundamental Science Practices: Review and Approval of Scientific Data for Release. This data set consists of digital water-table contours for the Morongo Basin. The U.S. Geological Survey constructed a water-table map of the Morongo ground-water basin for ground-water levels measured during the period January-October 1994. Water-level data were collected from 248 wells to construct the contours. The water-table contours were digitized from the paper map which was published at a scale of 1:125,000. The contour interval...
A potentiometric surface map for spring 2016 was created for the Mississippi River Valley alluvial (MRVA) aquifer, which was referenced to the North American Vertical Datum of 1988 (NAVD 88), using most of the available groundwater-altitude data from wells and surface-water-altitude data from streamgages. Most of the wells were measured annually or one time, after installation, but some wells were measured more than one time in a year and a small number of wells were measured continually. Streamgages were typically operated continuously. The potentiometric surface map for 2016 was created as part of the U.S. Geological Survey (USGS) Water Availability and Use Science Program to support investigations that characterize...
Types: Map Service,
OGC WFS Layer,
OGC WMS Layer,
OGC WMS Service;
Tags: Arkansas,
Hydrogeology,
Illinois,
Information Sciences,
Kentucky,
The U.S. Geological Survey (USGS) is providing online maps of water-table and potentiometric-surface altitude in the upper glacial, Magothy, Jameco, Lloyd, and North Shore aquifers on Long Island, New York, April–May 2016. Also provided is a depth-to-water map for Long Island, New York, April–May 2016. The USGS makes these maps and geospatial data available as REST Open Map Services (as well as HTTP, JSON, KML, and shapefile), so end-users can consume them on mobile and web clients. A companion report, U.S. Geological Survey Scientific Investigations Map 3398 (Como and others, 2018; https://doi.org/10.3133/sim3398) further describes data collection and map preparation and presents 68x22 in. Portable Document...
Categories: Data;
Types: ArcGIS REST Map Service,
ArcGIS Service Definition,
Citation,
Downloadable,
Map Service;
Tags: Long Island,
Nassau County,
New York,
Suffolk County,
depth to water,
The U.S. Geological Survey (USGS) is providing online maps of water-table and potentiometric-surface altitude in the upper glacial, Magothy, Jameco, Lloyd, and North Shore aquifers on Long Island, New York, April–May 2016. Also provided is a depth-to-water map for Long Island, New York, April–May 2016. The USGS makes these maps and geospatial data available as REST Open Map Services (as well as HTTP, JSON, KML, and shapefile), so end-users can consume them on mobile and web clients. A companion report, U.S. Geological Survey Scientific Investigations Map 3398 (Como and others, 2018; https://doi.org/10.3133/sim3398) further describes data collection and map preparation and presents 68x22 in. Portable Document...
Categories: Data;
Types: ArcGIS REST Map Service,
ArcGIS Service Definition,
Citation,
Downloadable,
Map Service;
Tags: Groundwater,
Hydrology,
Levels,
Long Island,
Nassau County,
This dataset contains groundwater-altitude (GWA) data from wells that were used or considered (indicated by the field USE_2020) to create a potentiometric-surface map for the Mississippi River Valley alluvial aquifer (MRVA) for spring 2020. The GWA data was referenced to the North American Vertical Datum of 1988 (NAVD 88). Most of the wells were measured annually, but some wells were measured more than one time in a year and a small number of wells were measured continuously. GWA data were from wells measured in spring 2020. To best reflect hydrologic conditions in the MRVA, the GWA data used to create the 2020 potentiometric surface would be measured in a short-time frame of days or a week and there would be available...
During 2006 and 2007 the Alaska Division of Geological & Geophysical Surveys conducted reconnaissance surficial-geologic mapping in segment 1 of the Alaska Highway corridor, which straddles the Alaska Highway through the Tanana River valley from Delta Junction to the eastern boundary of the Mt. Hayes Quadrangle. Surficial-geologic deposits were initially mapped by interpreting ~1:63,360-scale, false-color infrared aerial photographs taken in August 1980 and field verified in 2006-2007.
Selected water-level data for the shallow aquifer system in the Lower Gunnison River Basin, Colorado
This point dataset contains water-level information concerning depth to water, potentiometric-surface altitude, and saturated thickness for the shallow groundwater system at selected well and borehole locations in the Lower Gunnison River Basin in Delta, Montrose, Ouray, and Gunnison Counties, Colorado. Depth-to-water data were compiled from measurements reported by the Colorado Division of Water Resources, U.S. Geological Survey, and Bureau of Reclamation. Potentiometric-surface altitude values were computed from the potentiometric-surface altitude raster dataset (potalt). Saturated-thickness values were computed from the saturated-thickness raster dataset (satthk). The U.S. Geological Survey prepared this dataset...
Categories: Data;
Types: Downloadable,
Map Service,
OGC WFS Layer,
OGC WMS Layer,
Shapefile;
Tags: Colorado,
Delta,
Gunnison,
Montrose,
Ouray,

These data were released prior to the October 1, 2016 effective date for the USGS’s policy dictating the review, approval, and release of scientific data as referenced in USGS Survey Manual Chapter 502.8 Fundamental Science Practices: Review and Approval of Scientific Data for Release. During 2012, the U.S. Geological Survey and other agencies made approximately 2,500 water-level measurements in the Mojave River and Morongo groundwater basins. These data document recent conditions and, when compared with previous data, changes in groundwater levels. A water-level contour map was drawn using data from about 575 wells, providing coverage for most of the basins. Twenty-eight hydrographs show long-term (1930-2012)...
|

|
