Filters: Tags: watersheds (X)
433 results (25ms)|
Filters
Contacts
(Less)
|
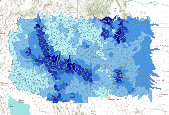
This dataset represents the average annual amount of water contributed to the stream network for each watershed, simulated by the model MC1 for the 30-year period 1971-2000. Simulated mean streamflow (stormflow + baseflow + runoff) was determined for each HUC5 watershed. Watersheds represent 5th level (HUC5, 10-digit) hydrologic unit boundaries and were acquired from the Natural Resources Conservation Service. Streamflow units are comparable to rainfall - millimeters of water per year. Background: The dynamic global vegetation model MC1 (see Bachelet et al. 2001) was used to simulate vegetation dynamics, associated carbon and nitrogen cycle, water budget, and wild fire impacts for OR, WA, AZ and NM, for a project...

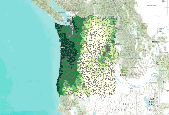
This dataset represents the average amount of soil carbon within each HUC5 watershed, simulated by the model MC1 for the 30-year period 1971-2000. Soil carbon, in g m-2, was determined for each HUC5 watershed. Watersheds represent 5th level (HUC5, 10-digit) hydrologic unit boundaries and were acquired from the Natural Resources Conservation Service. Background: The dynamic global vegetation model MC1 (see Bachelet et al.2001) was used to simulate vegetation dynamics, associated carbon and nitrogen cycle, water budget, and wild fire impacts for OR, WA, AZ and NM, for a project funded by the USDA Forest Service (PNW09-JV-11261900-003). The MC1 model was run using historical data and future climate change projections...
This dataset represents the average net primary production for each HUC5 watershed, simulated by the model MC1 for the 30-year period 1971-2000. Mean net primary production (in g m-2 per yr), was determined for each HUC5 watershed by averaging values of original ~ 4 km raster data. Watersheds represent 5th level (HUC5, 10-digit) hydrologic unit boundaries and were acquired from the Natural Resources Conservation Service. Background: The dynamic global vegetation model MC1 (see Bachelet et al.2001) was used to simulate vegetation dynamics, associated carbon and nitrogen cycle, water budget, and wild fire impacts for OR, WA, AZ and NM, for a project funded by the USDA Forest Service (PNW09-JV-11261900-003). The MC1...

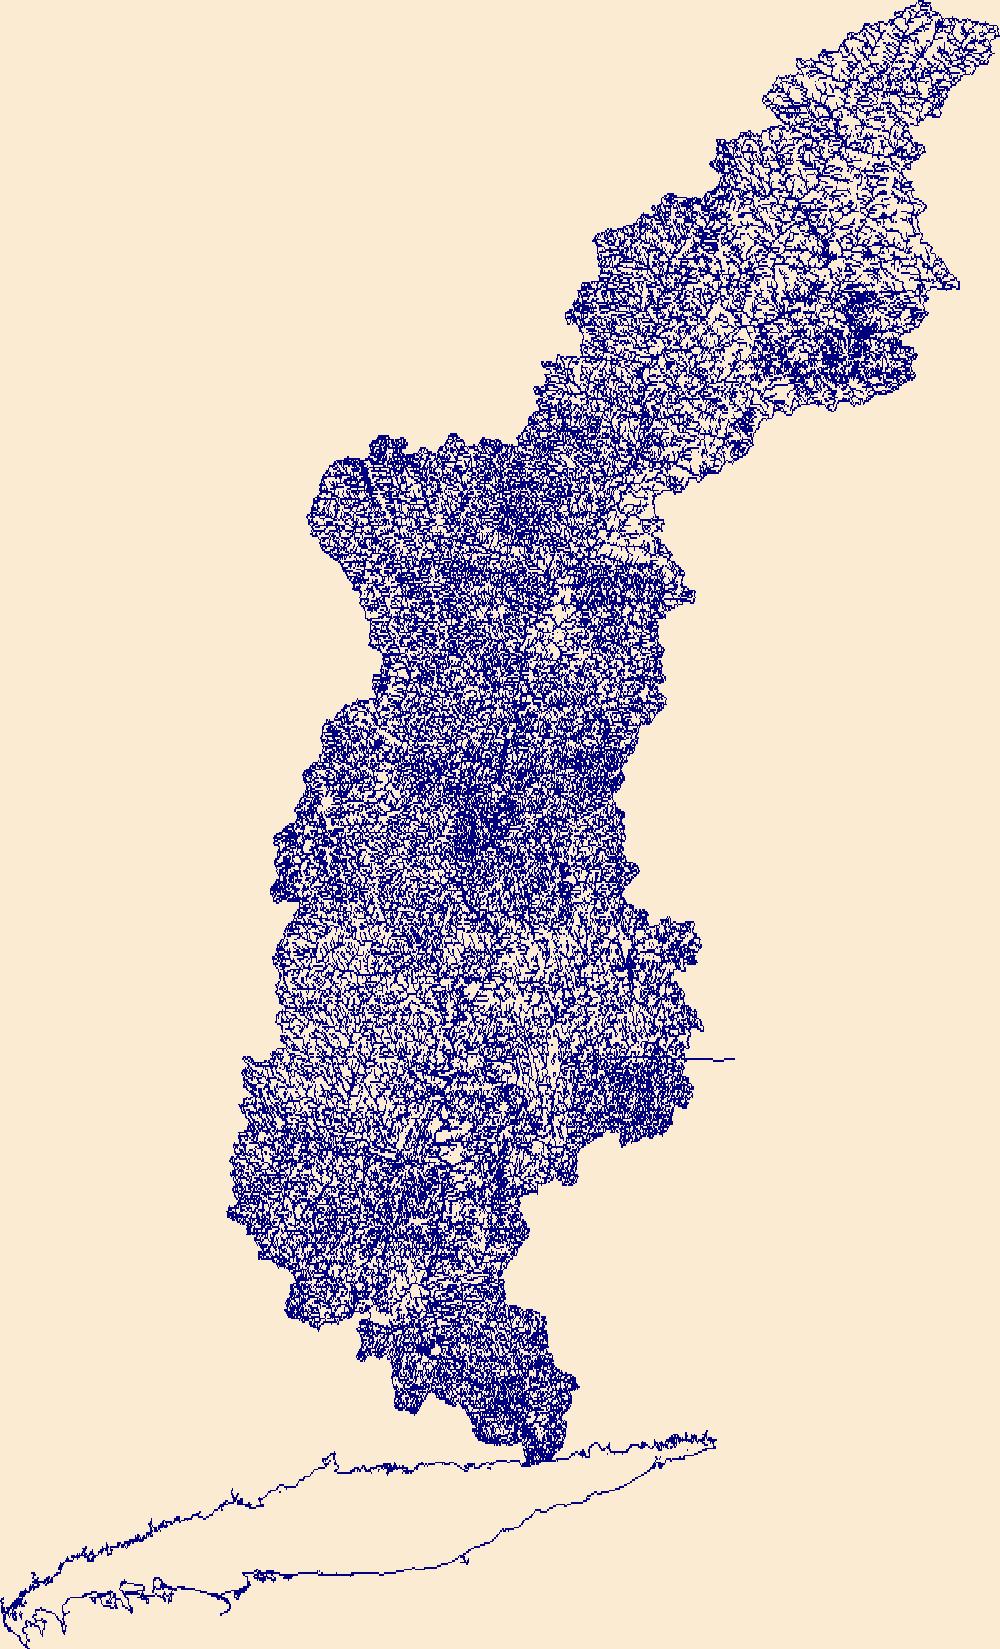
These data were provided by Dudek, for full metadata please contact them directly. Layer description from Appendix A: The California Interagency Watershed Map of 1999 (updated May 2004, "calw221") is the State of California's working definition of watershed boundaries. Previous Calwater versions (1.2 and 2.2) described California watersheds, beginning with the division of the State's 101 million acres into ten Hydrologic Regions (HR). Each HR is progressively subdivided into six smaller, nested levels: the Hydrologic Unit (HU, major rivers), Hydrologic Area (HA, major tributaries), Hydrologic Sub-Area (HSA), Super Planning Watershed (SPWS), and Planning Watershed (PWS). At the Planning Watershed (the most detailed...

Change in the majority generalized vegetation type for each HUC5 watershed between historical (1971-2000) and future (2071-2100) time periods. The MC1 dynamic vegetation model was run under the CSIRO, MIROC, and Hadley climate change projections and the A2 anthropogenic emissions scenario. Majority generalized vegetation type was determined for each HUC5 watershed from from original ~ 4 km raster data. Generalized vegetation types were assigned by combining detailed MC1 vegetation classes into four general catagories: desert, grassland, shrubland, and forest. Watersheds represent 5th level (HUC5, 10-digit) hydrologic unit boundaries and were acquired from the Natural Resources Conservation Service. Background:...

Percent change in the average surface runoff for each HUC5 watershed between historical (1971-2000) and future (2071-2100) time periods. The MC1 dynamic vegetation model was run under the CSIRO, MIROC, and Hadley climate change projections and the A2 anthropogenic emissions scenario.Simulated mean annual surface runoff (in mm H2O yr-1), was determined for each HUC5 watershed by averaging values of original ~ 4 km raster data. Watersheds represent 5th level (HUC5, 10-digit) hydrologic unit boundaries and were acquired from the Natural Resources Conservation Service. Background: The dynamic global vegetation model MC1 (see Bachelet et al. 2001) was used to simulate vegetation dynamics, associated carbon and nitrogen...

Percent change in the mean area burned per year (per ~4 km pixel ) for each HUC5 watershed between historical (1971-2000) and future (2071-2100) time periods. The MC1 dynamic vegetation model was run under the CSIRO, MIROC, and Hadley climate change projections and the A2 anthropogenic emissions scenario.Mean area burned per year per ~4 km pixel, (in square meters), was determined for each HUC5 watershed. Watersheds represent 5th level (HUC5, 10-digit) hydrologic unit boundaries and were acquired from the Natural Resources Conservation Service. Background: The dynamic global vegetation model MC1 (see Bachelet et al. 2001) was used to simulate vegetation dynamics, associated carbon and nitrogen cycle, water budget,...

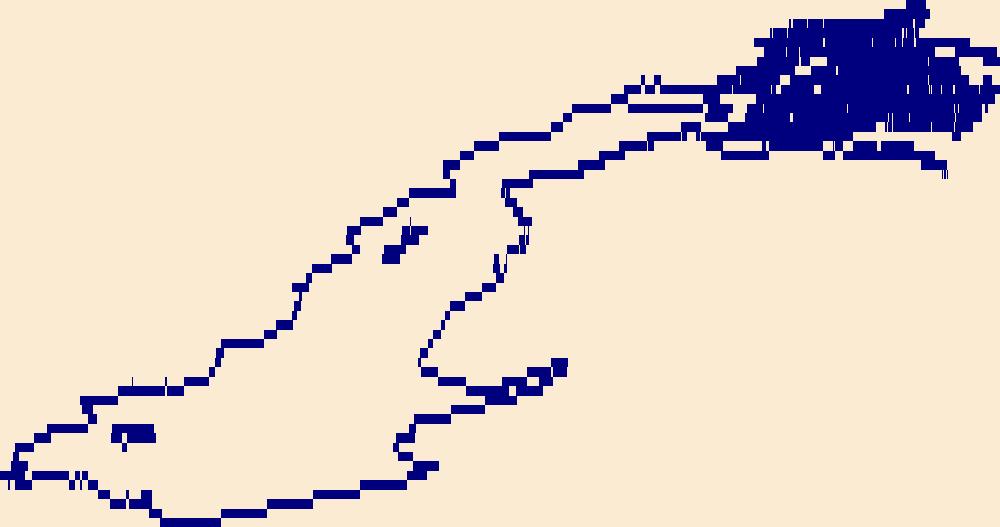
This dataset depicts watershed boundaries for St. Thomas and St. John, US Virgin Islands.
This shapefile contains sub-indices comprised of various anthropogenic land use/covers respresentative of the risk of potential habitat degradation to streams within the state of Hawaii. This file is an updated version of 'nfhap_hci_hawaii.shp' and incorporates the suggestion from the Hawaii Fish Habitat Partnership of removing trails and paths from the road network to help better represent amounts of disturbance in remote areas such as the Na Pali coast. Subindices are summarized for local and network catchments specific to perennial stream reaches throughout the state. The local and network catchments were developed using a modified version of the 1:24,000 scale National Hydrography Dataset (NHD) as a baselayer....
The purpose of the Conservation Effects Assessment Project (CEAP) cropland national assessment is to quantify the environmental benefits of conservation programs at the regional and national levels, which include both onsite and instream water quality benefits. Modeling is an effective tool for environmental assessment at the regional and national scale due to the complexities in nature at this scale. Two simulation models, the Agricultural Policy Environmental extender (APEX) and the Soil and Water Assessment Tool (SWAT), were used for the CEAP cropland national assessment. A subset of National Resources Inventory (NRI) sample points was selected to serve as "representative fields" for the CEAP cropland survey...
Categories: Publication;
Types: Citation;
Tags: Agriculture,
Channels,
Conservation,
Data Visualization & Tools,
ENA 06:Food & Drugs,
Six small, predominantly agricultural (> 70%) watersheds in the Conesus Lake catchment of New York State, USA, were selected to test the impact of Best Management Practices (BMPs) on mitigation of nonpoint nutrient sources and soil loss from farms to downstream aquatic systems. Over a 5-year period, intensive stream water monitoring and analysis of covariance provided estimates of marginal means of concentration and loading for each year weighted by covariate discharge. Significant reductions in total phosphorus, soluble reactive phosphorus, nitrate, total Kjeldahl nitrogen, and total suspended solids concentration and flux occurred by the second year and third year of implementation. At Graywood Gully, where Whole...
Categories: Publication;
Types: Citation;
Tags: Agriculture,
Best Management Practices,
Data Visualization & Tools,
Landscapes,
Northeast CASC,

These data were released prior to the October 1, 2016 effective date for the USGS’s policy dictating the review, approval, and release of scientific data as referenced in USGS Survey Manual Chapter 502.8 Fundamental Science Practices: Review and Approval of Scientific Data for Release. This dataset represents 19,031 basin boundaries and their streamgage locations for the U.S. Geological Survey's (USGS) active and historical streamgages from the published dataset of Stewart and others (2006) and its subsequent updates (D.W. Stewart, USGS, written commun., 2011). Only the basin boundaries that were delineated within 15 percent of the basin area reported in the National Water Information System (NWIS) were included...
Change in the majority generalized vegetation type for each HUC5 watershed between historical (1971-2000) and future (2071-2100) time periods. The MC1 dynamic vegetation model was run under the CSIRO, MIROC, and Hadley climate change projections and the A2 anthropogenic emissions scenario. Majority generalized vegetation type was determined for each HUC5 watershed from from original ~ 4 km raster data. Generalized vegetation types were assigned by combining detailed MC1 vegetation classes into four general catagories: desert, grassland, shrubland, and forest. Watersheds represent 5th level (HUC5, 10-digit) hydrologic unit boundaries and were acquired from the Natural Resources Conservation Service. Background:...
This dataset represents the average amount of live tree carbon for each HUC5 watershed, simulated by the model MC1 for the 30-year period 1971-2000. Simulated mean live forest carbon (output variable C_Forestyr in MC1 version B60, which includes both above and below-ground tree carbon) was determined for each HUC5 watershed. Units are grams per square meter. Watersheds represent 5th level (HUC5, 10-digit) hydrologic unit boundaries and were acquired from the Natural Resources Conservation Service. Background: The dynamic global vegetation model MC1 (see Bachelet et al. 2001) was used to simulate vegetation dynamics, associated carbon and nitrogen cycle, water budget, and wild fire impacts for OR, WA, AZ and...
Percent change in the mean area burned per year (per ~4 km pixel) for each HUC5 watershed between historical (1971-2000) and future (2071-2100) time periods. The MC1 dynamic vegetation model was run under the CSIRO, MIROC, and Hadley climate change projections and the A2 anthropogenic emissions scenario. Mean area burned per year per ~4 km pixel (in square meters), was determined for each HUC5 watershed. Watersheds represent 5th level (HUC5, 10-digit) hydrologic unit boundaries and were acquired from the Natural Resources Conservation Service. Background: The dynamic global vegetation model MC1 (see Bachelet et al. 2001) was used to simulate vegetation dynamics, associated carbon and nitrogen cycle, water...
This dataset represents the average amount of Growing Degree Days (GDD) per year within each HUC5 watershed, simulated by the model MC1 for the 30-year period 1971-2000. Growing degree days (referenced to 0oC) (unit = deg C days) were determined for each HUC5 watershed. Watersheds represent 5th level (HUC5, 10-digit) hydrologic unit boundaries. They were acquired from the Natural Resources Conservation Service. Background: The dynamic global vegetation model MC1 (see Bachelet et al. 2001) was used to simulate vegetation dynamics, associated carbon and nitrogen cycle, water budget, and wild fire impacts for OR, WA, AZ and NM, for a project funded by the USDA Forest Service (PNW 09-JV-11261900-003). The MC1 model...
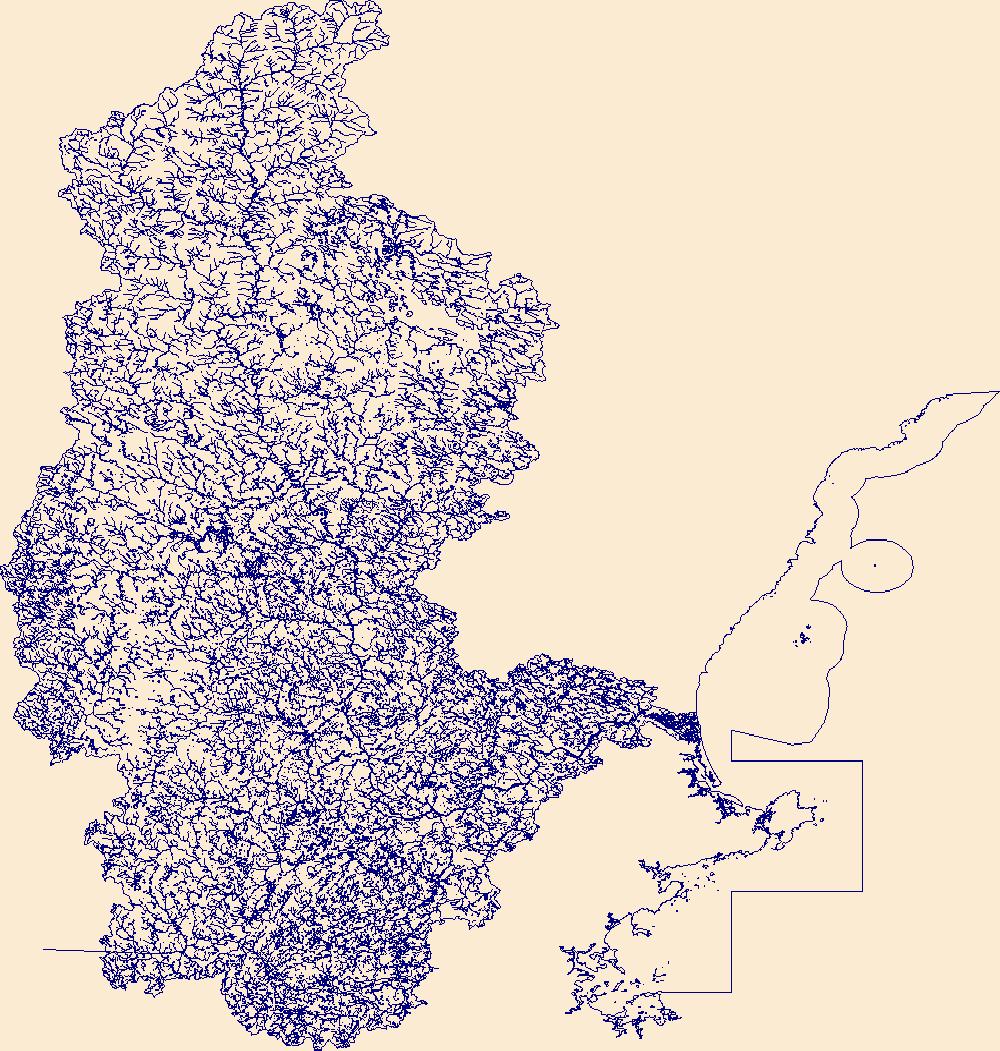
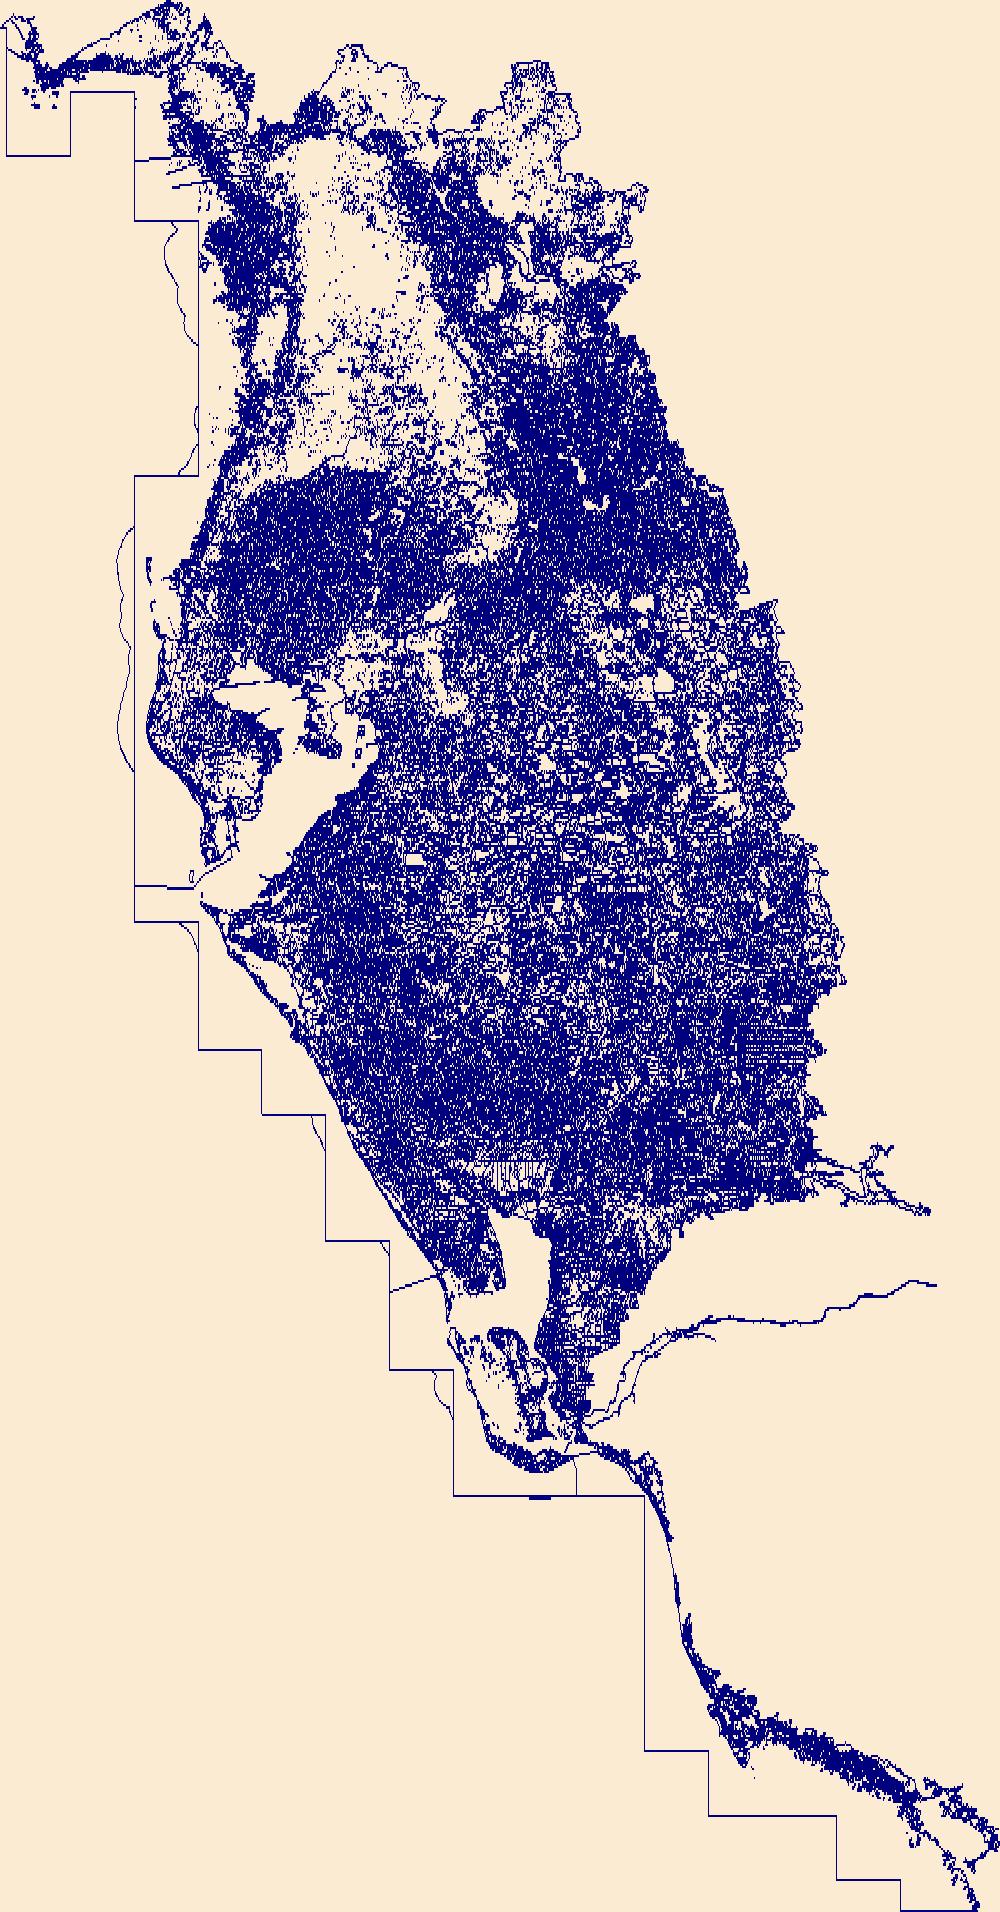
The High Resolution National Hydrography Dataset Plus (NHDPlus HR) is an integrated set of geospatial data layers, including the National Hydrography Dataset (NHD), National Watershed Boundary Dataset (WBD), and 3D Elevation Program Digital Elevation Model (3DEP DEM). The NHDPlus HR combines the NHD, 3DEP DEMs, and WBD to a data suite that includes the NHD stream network with linear referencing functionality, the WBD hydrologic units, elevation-derived catchment areas for each stream segment, "value added attributes" (VAAs), and other features that enhance hydrologic data analysis and routing.
The High Resolution National Hydrography Dataset Plus (NHDPlus HR) is an integrated set of geospatial data layers, including the best available National Hydrography Dataset (NHD), the 10-meter 3D Elevation Program Digital Elevation Model (3DEP DEM), and the National Watershed Boundary Dataset (WBD). The NHDPlus HR combines the NHD, 3DEP DEMs, and WBD to create a stream network with linear referencing, feature naming, "value added attributes" (VAAs), elevation-derived catchments, and other features for hydrologic data analysis. The stream network with linear referencing is a system of data relationships applied to hydrographic systems so that one stream reach "flows" into another and "events" can be tied to and traced...
|

|
