Filters: Tags: wood thrush (X) > partyWithName: Phil Nott, The Institute for Bird Populations (X)
16 results (30ms)|
Filters
Date Range
Tag Schemes |
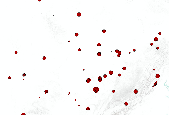
Wood Thrush (Midwest) results from Midwest MAPS stations

Distribution of Wood Thrush mean wing chord length at MAPS stations during the period 1992-2008 throughout Midwestern states (plus 250km buffer).

All Indiana Ebird records (observations only) for May through August inclusive. At each observation point we averaged the count per observation instance.

Map of BBS routes and WOTH counts (birds/year). The thickness of the lines are proportional to the numbers of birds observed.

Distribution of Wood Thrush adult trend at MAPS stations during the period 1992-2008 throughout Midwestern states (plus 250km buffer).

Distribution of Wood Thrush adult captures at MAPS stations during the period 1992-2008 throughout Midwestern states (plus 250km buffer).

Correlation map for annual Wood Thrush captures at NSA Crane, IN between 1994 and 2008. The dependent variable ADPBR represents the proportion of adult captures in active breeding condition based on scores for cloacal protuberance and brood patch. The independent variable represents GPCP precipitation in southern Indiana during the breeding season (May-August).

Indiana Ebird observation points 1900-2011 from AKN sampling events download tool.

Distribution of Wood Thrush mean adult day of capture at MAPS stations during the period 1992-2008 throughout Midwestern states (plus 250km buffer).

Distribution of Wood Thrush mean known age at MAPS stations during the period 1992-2008 throughout Midwestern states (plus 250km buffer).

Distribution of Wood Thrush productivity at MAPS stations during the period 1992-2008 throughout Midwestern states (plus 250km buffer).

Wood Thrush station lifetime productivity (STAPI) (log transformed) ranged between -0.016 and +0.435 with a mean value of +0.210 and a median value of +0.190. ________________________________________ Model 1 (3 parameters) Wood Thrush station lifetime productivity (STAPI) (log transformed) was a function of: a) INTERCEPT (0.19951), b) NLCD06AG33P (+0.02430) - percent agricultural/grassland cover, 990m-resolution (33x aggregation of 30m-resolution), ranged between -1.143 and +4.989 (95% CL) with a mean value of +1.923 and a median value of +2.338, c) DIST2RIV15 (-0.04755) - distance (m) to stream, ranged between -0.114 and +1.654 (95% CL) with a mean value of +0.770 and a median value of +0.749. This model...

BBS Route buffers (1km) associated with Wood Thrush. Units are birds/route in field ABU0477550.

Distribution of Wood Thrush proportion of adults in breeding condition at MAPS stations during the period 1992-2008 throughout Midwestern states (plus 250km buffer).

Predicted Wood Thrush AHY Captures (per station-year) I applied the second equivalent model (by ICOMP) to mapping predicted number of WOTH AHY captures. The model features affinities to deciduous forest in the 5km context (median >50%), and above ground biomass (median 94 MG/ha) which infers that captures increase from mid-successional deciduous forest through mature forest habitat). The selected model suggests that conservation of Wood Thrush breeding habitat must preserve large tracts of mature deciduous forest. The productivity model differs. ________________________________________ Wood Thrush - VizBand/Land AIC Model Selection Created: 31-May-2011 Wood Thrush annual capture rate of adult (ADULT)...

Distribution of Wood Thrush mean known age at MAPS stations during the period 1992-2008 throughout Midwestern states (plus 250km buffer).
|

|
