Filters: Tags: yale (X)
299 results (72ms)|
Filters
|
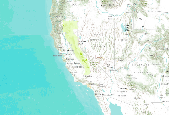
Simulated understory index (fraction of grass vegetation carbon in forest, ((aglivcx + bglivcx) / frstc)) averaged over 2046-2065 simulated by MC1 (Lenihan et al. 2008) at a 10 km x 10 km grid cell size under general circulation model PCM1 (Washington et al. 2000; Meehl et al. 2003) under the A2 emission scenario. References: Meehl, G.A., W.M. Washington, T.M.L. Wigley, J.M. Arblaster, and A. Dai. 2003. Solar and greenhouse gas forcing and climate response in the twentieth century. J Climate 16:426–444. Washington, W.M., J.W. Weatherly, G.A. Meehl, A.J. Semtner, T.W. Bettge, A.P. Craig, W.G. Stran, J. Arblaster, V.B. Wayland, R. James , and Y. Zhang. 2000. Parallel climate model (PCM) control and transient simulations....

Future summer (July – September) precipitation (mm, averaged over 2046-2065) simulated by the MC1 dynamic global vegetation model (Bachelet et al. 2001) at a 4 km x 4 km spatial resolution using future climate projections provided through CMIP3 (http://www-pcmdi.llnl.gov/ipcc/about_ipcc.php). Future climate drivers were generated using statistical downscaling (simple delta method) of general circulation model projections, in this case Hadley CM3 (Johns et al. 2003) under the A2 emission scenario (Naki?enovi? et al. 2000). The deltas (differences for temperatures and ratios for precipitation) were used to modify PRISM 4km historical baseline (Daly et al. 1994). Note: The MC1 model is described in data basin (http://databasin.org/climate-center/features/mc1-dynamic-global-veget...

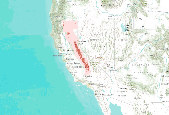
Predicted probability of fisher year-round occurrence created with Maxent (Phillips et al. 2006) using fisher detections (N = 302, spanning 1990 – 2011) and five predictor variables: mean annual precipitation, mean summer (July – September) precipitation, mean understory index (fraction of grass vegetation carbon in forest), mean forest carbon (g C m2), and mean fraction of vegetation carbon in forest. Predictor variables had a grid cell size of 800 m by 800 m, vegetation variables were simulated with MC1 dynamic global vegetation model (Bachelet et al. 2001) and historical climate variables were provided by the PRISM GROUP (Daly et al. 2008). This fisher distribution model has a 10-fold cross-validated AUC of...

Fraction of vegetation carbon burned averaged over 2046-2065 simulated by the MC1 dynamic global vegetation model (Bachelet et al. 2001) at a 800 m x 800 m spatial resolution using future climate projections provided through CMIP3 (http://www-pcmdi.llnl.gov/ipcc/about_ipcc.php). Future climate drivers were generated using statistical downscaling (simple delta method) of general circulation model projections, in this case MIROC 3.2 medres (Hasumi and Emori 2004) under the A2 emission scenario (Naki?enovi? et al. 2000). The deltas (differences for temperatures and ratios for precipitation) were used to modify PRISM 800 m historical baseline (Daly et al. 2008). Note: The MC1 model is described in data basin (http://databasin.org/climate-center/features/mc1-dynamic-global-vegetat...

Number of months/year with mean temperature < 0°C (averaged over 2046-2065) simulated by the MC1 dynamic global vegetation model (Bachelet et al. 2001) at a 4 km x 4 km spatial resolution using future climate projections provided through CMIP3 (http://www-pcmdi.llnl.gov/ipcc/about_ipcc.php). Future climate drivers were generated using statistical downscaling (simple delta method) of general circulation model projections, in this case Hadley CM3 (Johns et al. 2003) under the A2 emission scenario (Naki?enovi? et al. 2000). The deltas (differences for temperatures and ratios for precipitation) were used to modify PRISM 4km historical baseline (Daly et al. 1994). Note: The MC1 model is described in data basin (http://databasin.org/climate-center/features/mc1-dynamic-global-vegeta...

Future annual precipitation (mm, averaged over 2076-2095) simulated with the MC1 dynamic global vegetation model (Bachelet et al. 2001) at a 4 km x 4 km spatial resolution using future climate projections provided through CMIP3 (http://www-pcmdi.llnl.gov/ipcc/about_ipcc.php). Future climate drivers were generated using statistical downscaling (simple delta method) of general circulation model projections, in this case Hadley CM3 (Johns et al. 2003) under the A2 emission scenario (Naki?enovi? et al. 2000). The deltas (differences for temperatures and ratios for precipitation) were used to modify PRISM 4km historical baseline (Daly et al. 1994). Note: The MC1 model is described in data basin (http://databasin.org/climate-center/features/mc1-dynamic-global-vegetation-model)....

Future understory index (fraction of grass vegetation carbon in forest, ((aglivcx + bglivcx) / frstc)), averaged over 2046-2065) simulated by the MC1 dynamic global vegetation model (Bachelet et al. 2001) at a 4 km x 4 km spatial resolution using future climate projections provided through CMIP3 (http://www-pcmdi.llnl.gov/ipcc/about_ipcc.php). Future climate drivers were generated using statistical downscaling (simple delta method) of general circulation model projections, in this case MIROC 3.2 medres (Hasumi and Emori 2004) under the A2 emission scenario (Naki?enovi? et al. 2000). The deltas (differences for temperatures and ratios for precipitation) were used to modify PRISM 4km historical baseline (Daly et...
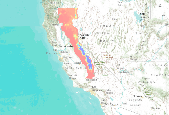
Future (2076-2095) predicted probability of marten year-round occurrence projected under the A2 emissions scenario with the PCM1 GCM (Washington et al. 2000; Meehl et al. 2003). The projected marten distribution was created with Maxent (Phillips et al. 2006) using marten detections (N = 302, spanning 1990 – 2011) and nine predictor variables: mean annual precipitation, mean summer (July – September) precipitation, mean summer temperature amplitude, mean annual temperature maximum, mean fraction of vegetation carbon burned, mean understory index, mean vegetation carbon (g C m2), modal vegetation class, and average maximum tree LAI. Predictor variables had a grid cell size of 10 km, vegetation variables were simulated...

Future winter (January – March) minimum temperature (°C, averaged over 2076-2095) at a 4 km x 4 km spatial resolution using future climate projections provided through CMIP3 (http://www-pcmdi.llnl.gov/ipcc/about_ipcc.php). Future climate drivers were generated using statistical downscaling (simple delta method) of general circulation model projections, in this case Hadley CM3 (Johns et al. 2003) under the A2 emission scenario (Naki?enovi? et al. 2000). The deltas (differences for temperatures and ratios for precipitation) were used to modify PRISM 4km historical baseline (Daly et al. 1994). Note: The MC1 model is described in data basin (http://databasin.org/climate-center/features/mc1-dynamic-global-vegetation-model)....

Mean fraction of vegetation carbon burned over 1986 – 2005, simulated by the MC1 dynamic global vegetation model (Bachelet et al. 2001) at a 800 m x 800 m spatial resolution using PRISM climate for the historical period (Daly et al. 2008). This effort is part of a pilot project to apply and evaluate the Yale Framework (Yale Science Panel for Integrating Climate Adaptation and Landscape Conservation Planning). Note: The MC1 model is described in data basin (http://databasin.org/climate-center/features/mc1-dynamic-global-vegetation-model). References: Bachelet D., R.P. Neilson, J. M. Lenihan, and R.J. Drapek. 2001. Climate change effects on vegetation distribution and carbon budget in the U.S. Ecosystems 4:164-185....

Difference between maximum and minimum temperatures (°C) during summer (July – September; averaged over 2046-2065) at a 4 km x 4 km spatial resolution using future climate projections provided through CMIP3 (http://www-pcmdi.llnl.gov/ipcc/about_ipcc.php). Future climate drivers were generated using statistical downscaling (simple delta method) of general circulation model projections, in this case MIROC 3.2 medres (Hasumi and Emori 2004) under the A2 emission scenario (Naki?enovi? et al. 2000). The deltas (differences for temperatures and ratios for precipitation) were used to modify PRISM 4km historical baseline (Daly et al. 1994). Note: The MC1 model is described in data basin (http://databasin.org/climate-center/features/mc1-dynamic-global-vegetation-model)....
: Number of months/year with mean temperature < 0°C (averaged over 2046-2065) simulated by the MC1 dynamic global vegetation model (Bachelet et al. 2001) at a 4 km x 4 km spatial resolution using future climate projections provided through CMIP3 (http://www-pcmdi.llnl.gov/ipcc/about_ipcc.php). Future climate drivers were generated using statistical downscaling (simple delta method) of general circulation model projections, in this case MIROC 3.2 medres (Hasumi and Emori 2004) under the A2 emission scenario (Naki?enovi? et al. 2000). The deltas (differences for temperatures and ratios for precipitation) were used to modify PRISM 4km historical baseline (Daly et al. 1994). Note: The MC1 model is described in data...
Modal vegetation class over 1986 – 2005, simulated with MC1 (Lenihan et al. 2008) and a 10 km x 10 km grid cell size. Grid Value: Vegetation Type 1: ALPINE 2: SUBALPINE FOREST 3: COAST EVERGREEN FOREST 11: PINYON-JUNIPER 4: SIERRAN EVERGREEN FOREST 6: MIXED EVERGREEN FOREST 15: GREAT BASIN EVERGREEN WOODLAND 10: MIXED EVERGREEN WOODLAND 20: SAGEBRUSH STEPPE 17: C3 GRASSLAND 18: C4 GRASSLAND 19: CHAPARRAL 17: C3 GRASSLAND 18: C4 GRASSLAND 21: DESERT

Mean annual precipitation (mm) averaged over 2046-2065 from the general circulation model PCM1 (Washington et al. 2000; Meehl et al. 2003) under the A2 emission scenario with a grid cell size of 10 km x 10km. References: Meehl, G.A., W.M. Washington, T.M.L. Wigley, J.M. Arblaster, and A. Dai. 2003. Solar and greenhouse gas forcing and climate response in the twentieth century. J Climate 16:426–444. Washington, W.M., J.W. Weatherly, G.A. Meehl, A.J. Semtner, T.W. Bettge, A.P. Craig, W.G. Stran, J. Arblaster, V.B. Wayland, R. James , and Y. Zhang. 2000. Parallel climate model (PCM) control and transient simulations. Clim Dyn 16: 755–774.

Maximum temperature (°C) averaged over 1986 – 2005, with a grid cell size of 10 km x 10km, provided by the PRISM group (Daly et al. 1994).

Mean minimum temperature (°C) averaged over 2076-2095 from the general circulation model PCM1 (Washington et al. 2000; Meehl et al. 2003) under the A2 emission scenario with a grid cell size of 10 km x 10km. References: Meehl, G.A., W.M. Washington, T.M.L. Wigley, J.M. Arblaster, and A. Dai. 2003. Solar and greenhouse gas forcing and climate response in the twentieth century. J Climate 16:426–444. Washington, W.M., J.W. Weatherly, G.A. Meehl, A.J. Semtner, T.W. Bettge, A.P. Craig, W.G. Stran, J. Arblaster, V.B. Wayland, R. James , and Y. Zhang. 2000. Parallel climate model (PCM) control and transient simulations. Clim Dyn 16: 755–774.

Mean minimum temperature (°C) averaged over 2046-2065 from the general circulation model PCM1 (Washington et al. 2000; Meehl et al. 2003) under the A2 emission scenario with a grid cell size of 10 km x 10km. References: Meehl, G.A., W.M. Washington, T.M.L. Wigley, J.M. Arblaster, and A. Dai. 2003. Solar and greenhouse gas forcing and climate response in the twentieth century. J Climate 16:426–444. Washington, W.M., J.W. Weatherly, G.A. Meehl, A.J. Semtner, T.W. Bettge, A.P. Craig, W.G. Stran, J. Arblaster, V.B. Wayland, R. James , and Y. Zhang. 2000. Parallel climate model (PCM) control and transient simulations. Clim Dyn 16: 755–774.

Mean maximum temperature (°C) averaged over 2046-2065 from the general circulation model PCM1 (Washington et al. 2000; Meehl et al. 2003) under the A2 emission scenario with a grid cell size of 10 km x 10km. References: Meehl, G.A., W.M. Washington, T.M.L. Wigley, J.M. Arblaster, and A. Dai. 2003. Solar and greenhouse gas forcing and climate response in the twentieth century. J Climate 16:426–444. Washington, W.M., J.W. Weatherly, G.A. Meehl, A.J. Semtner, T.W. Bettge, A.P. Craig, W.G. Stran, J. Arblaster, V.B. Wayland, R. James , and Y. Zhang. 2000. Parallel climate model (PCM) control and transient simulations. Clim Dyn 16: 755–774.

Future maximum tree LAI (m2/m2, averaged over 2046-2065) simulated by the MC1 dynamic global vegetation model (Bachelet et al. 2001) at a 4 km x 4 km spatial resolution using future climate projections provided through CMIP3 (http://www-pcmdi.llnl.gov/ipcc/about_ipcc.php). Future climate drivers were generated using statistical downscaling (simple delta method) of general circulation model projections, in this case MIROC 3.2 medres (Hasumi and Emori 2004) under the A2 emission scenario (Naki?enovi? et al. 2000). The deltas (differences for temperatures and ratios for precipitation) were used to modify PRISM 4km historical baseline (Daly et al. 1994). Note: The MC1 model is described in data basin (http://databasin.org/climate-center/features/mc1-dynamic-global-vegetation-mode...

Future potential evapotranspiration (mm; averaged over 2046-2065) simulated by the MC1 dynamic global vegetation model (Bachelet et al. 2001) at a 4 km x 4 km spatial resolution using future climate projections provided through CMIP3 (http://www-pcmdi.llnl.gov/ipcc/about_ipcc.php). Future climate drivers were generated using statistical downscaling (simple delta method) of general circulation model projections, in this case MIROC 3.2 medres (Hasumi and Emori 2004) under the A2 emission scenario (Naki?enovi? et al. 2000). The deltas (differences for temperatures and ratios for precipitation) were used to modify PRISM 4km historical baseline (Daly et al. 1994). Note: The MC1 model is described in data basin (http://databasin.org/climate-center/features/mc1-dynamic-global-vegeta...
|

|
