Filters: Tags: usgs (X) > Categories: Data Release - Revised (X)
20 results (107ms)|
Filters
Date Range
Extensions Types Contacts
Categories Tag Types Tag Schemes |
The database contains uniformly processed ground motion intensity measurements (peak horizontal ground motions and 5-percent-damped pseudospectral accelerations for oscillator periods 0.1–10 s). The earthquake event set includes more than 3,800 M≥3 earthquakes in Oklahoma and Kansas from January 2009 to December 2016. Ground motion time series were collected out to 500 km. We also relocated the majority of the earthquake hypocenters using a multiple-event relocation algorithm to produce a set of near-uniformly processed hypocentral locations. Details about data processing are reported in the accompanying article. First posted - October 11, 2017 Revised - December 18, 2017, ver. 1.1
Categories: Data,
Data Release - Revised;
Tags: EHP,
Earthquake Hazards Program,
GHSC,
Geologic Hazards Science Center,
Kansas,
First Release: November 2018 The Coastal Storm Modeling System (CoSMoS) makes detailed predictions (meter-scale) over large geographic scales (100s of kilometers) of storm-induced coastal flooding and erosion for both current and future sea-level rise (SLR) scenarios. CoSMoS v3.1 for Central California shows projections for future climate scenarios (sea-level rise and storms) to provide emergency responders and coastal planners with critical storm-hazards information that can be used to increase public safety, mitigate physical damages, and more effectively manage and allocate resources within complex coastal settings. Data for Central California covers the coastline from Pt. Conception to Golden Gate Bridge....
Categories: Data Release - Revised;
Types: Map Service,
OGC WFS Layer,
OGC WMS Layer,
OGC WMS Service;
Tags: Beaches,
CMHRP,
Central California,
Central California Coast,
Climate change,
Currently, there are many datasets describing landslides caused by individual earthquakes, and global inventories of earthquake-induced landslides (EQIL). However, until recently, there were no datasets that provide a comprehensive description of the impacts of earthquake-induced landslide events. In this data release, we present an up-to-date, comprehensive global database containing all literature-documented earthquake-induced landslide events for the 249-year period from 1772 through August 2021. The database represents an update of the catalog developed by Seal et al. (2020), which summarized events through March 2020 and was based on the catalog developed by Nowicki Jessee et al. (2020). The revised catalog...
Categories: Data,
Data Release - Revised;
Tags: Database,
Disaster Impact,
Earthquake,
Earthquake Hazards,
Earthquake-induced landslide,
Version 4.0 of this data release provides descriptions of more than 200 mineral districts, mines, and mineral occurrences (deposits, prospects, and showings) within the United States that are reported to contain substantial enrichments of the rare earth elements (REEs). These mineral occurrences include mined deposits, exploration prospects, and other occurrences with notable concentrations of the REEs. The inclusion of a particular mineral occurrence in this database is not meant to imply that it has economic potential. Rather, these occurrences were included to capture the distribution and characteristics of the known, reported REEs deposits in the United States, which are diverse in their geology and resource...
Categories: Data,
Data Release - Revised;
Types: ArcGIS REST Map Service,
ArcGIS Service Definition,
Downloadable,
Map Service;
Tags: Alaska,
Arizona,
Arkansas,
BLM,
Bureau of Land Management,
Water supply lakes are the primary source of water for many communities in northern and western Missouri. Therefore, accurate and up-to-date estimates of lake capacity are important for managing and predicting adequate water supply. Many of the water supply lakes in Missouri were previously surveyed by the U.S. Geological Survey in the early 2000s (Richards, 2013) and in 2013 (Huizinga, 2014); however, years of potential sedimentation may have resulted in reduced water storage capacity. Periodic bathymetric surveys are useful to update the area/capacity table and to determine changes in the bathymetric surface. From July 2019 to June 2020, the U.S. Geological Survey, in cooperation with the Missouri Department...
Categories: Data Release - Revised;
Types: Map Service,
OGC WFS Layer,
OGC WMS Layer,
OGC WMS Service;
Tags: Bathymetry,
Bathymetry and Elevation,
Bethany,
Caldwell County,
Daviess County,
These data are high-resolution bathymetry (riverbed elevation) in ASCII format, generated from hydrographic surveys near six highway bridge structures over the Gasconade River in central Missouri. These sites were surveyed in June 2017 to help identify possible effects from extreme flooding on May 1-2, 2017. At the five downstream sites, hydrographic data were collected using a high-resolution multibeam echosounder mapping system (MBMS), which consists of a multibeam echosounder (MBES) and an inertial navigation system (INS) mounted on a marine survey vessel. Data were collected as the vessel traversed the river along planned survey lines distributed throughout the reach. Data collection software integrated and...
Version 10.0 of these data are part of a larger U.S. Geological Survey (USGS) project to develop an updated geospatial database of mines, mineral deposits, and mineral regions in the United States. Mine and prospect-related symbols, such as those used to represent prospect pits, mines, adits, dumps, tailings, etc., hereafter referred to as “mine” symbols or features, have been digitized from the 7.5-minute (1:24,000, 1:25,000-scale; and 1:10,000, 1:20,000 and 1:30,000-scale in Puerto Rico only) and the 15-minute (1:48,000 and 1:62,500-scale; 1:63,360-scale in Alaska only) archive of the USGS Historical Topographic Map Collection (HTMC), or acquired from available databases (California and Nevada, 1:24,000-scale...
Categories: Data,
Data Release - Revised;
Types: ArcGIS REST Map Service,
ArcGIS Service Definition,
Downloadable,
Map Service;
Tags: Alabama (AL),
Alaska (AK),
Arizona (AZ),
Arkansas (AR),
California (CA),
The 2014 update of the U.S. Geological Survey (USGS) National Seismic Hazard Model (NSHM) for the conterminous United States (2014 NSHM; Petersen and others, 2014; https://pubs.usgs.gov/of/2008/1128/) included probabilistic ground motion maps for 2 percent and 10 percent probabilities of exceedance in 50 years, derived from seismic hazard curves for peak ground acceleration (PGA) and 0.2 and 1.0 second spectral accelerations (SAs) with 5 percent damping for the National Earthquake Hazards Reduction Program (NEHRP) site class boundary B/C (time-averaged shear wave velocity in the upper 30 meters [VS30]=760 meters per second [m/s]). This data release provides 0.1 degree by 0.1 degree gridded seismic hazard curves,...
Categories: Data Release - Revised;
Tags: Conterminous U.S.,
EHP,
Earthquake Hazards Program,
GHSC,
Geologic Hazards Science Center,
The Massachusetts Office of Coastal Zone Management launched the Shoreline Change Project in 1989 to identify erosion-prone areas of the coast. The shoreline position and change rate are used to inform management decisions regarding the erosion of coastal resources. In 2001, a shoreline from 1994 was added to calculate both long- and short-term shoreline change rates along ocean-facing sections of the Massachusetts coast. In 2013, two oceanfront shorelines for Massachusetts were added using 2008-9 color aerial orthoimagery and 2007 topographic lidar datasets obtained from the National Oceanic and Atmospheric Administration's Ocean Service, Coastal Services Center. This 2018 data release includes rates that incorporate...
Categories: Data Release - Revised;
Types: Map Service,
OGC WFS Layer,
OGC WMS Layer,
OGC WMS Service;
Tags: Accretion,
Atlantic Coast,
Baseline,
CMGP,
Coastal and Marine Geology Program,
The updated 2018 National Seismic Hazard Model includes new ground motion models, aleatory uncertainty, and soil amplification factors for the central and eastern U.S. and incorporates basin depths from local seismic velocity models in four western U.S. (WUS) urban areas. These additions allow us, for the first time, to calculate probabilistic seismic hazard curves for an expanded set of spectral periods (0.01 s to 10 s) and site classes (VS30 = 150 m/s to 1,500 m/s) for the conterminous U.S. (CONUS), as well as account for amplification of long-period ground motions in deep sedimentary basins in the Los Angeles, San Francisco Bay, Salt Lake City, and Seattle regions. Ground motion data for 2, 5, and 10 percent...
Categories: Data,
Data Release - Revised;
Tags: Conterminous U.S.,
EHP,
Earthquake Hazards Program,
GHSC,
Geologic Hazards Science Center,
Data were collected by the U.S. Geological Survey (USGS) Pacific Coastal and Marine Science Center to investigate the influence of wind waves on sediment dynamics in two flooded agricultural tracts in the northern Sacramento-San Joaquin Delta: Little Holland Tract and Liberty Island. This effort is part of a large interdisciplinary study led by the USGS California Water Science Center and funded by the U.S. Bureau of Reclamation to investigate how shallow-water habitats in the Sacramento-San Joaquin Delta function and whether they provide good habitat for native fish species, including the Delta smelt. Elevated turbidity is a requirement for Delta smelt habitat, and turbidity is largely comprised of suspended sediment....
Categories: Data,
Data Release - Revised;
Types: Citation;
Tags: Average Burst Pressure,
CMG,
CMGP,
CONDUCTIVITY,
CTD > CONDUCTIVITY, TEMPERATURE, DEPTH,
In 2009, the Kootenai Tribe of Idaho released and implemented the Kootenai River Habitat Restoration Master Plan. This plan aimed to restore, enhance, and maintain the Kootenai River habitat and landscape to support and sustain habitat conditions for aquatic species and animal populations. In support of these restoration efforts, the U.S. Geological Survey, in cooperation with the Kootenai Tribe of Idaho, conducted high-resolution multibeam echosounder bathymetric surveys, velocity surveys, and collected images of substrate in the Lower Meander Reach (RM 143 - 145.5) and Straight Reach (RM 151 - 152). This data release contains bathymetry, velocity, and substrate data from surveys performed on the Kootenai River...
Categories: Data Release - Revised;
Types: Map Service,
OGC WFS Layer,
OGC WMS Layer,
OGC WMS Service;
Tags: ASCII,
Bathymetry,
Bonners Ferry,
Doppler,
Geology,
First Release: Aug 2017 Revised: May 2018 (ver. 1.1) Time-series data of velocity, pressure, turbidity, conductivity, and temperature were collected near the mouth of the Elwha River, Washington, USA, from December 2010 through October 2014, for the Department of Interior’s Elwha River Restoration project. As part of this project, the U.S. Geological Survey studied the effects of renewed sediment supplies on the coastal ecosystems before, during, and following the removal of two dams, Elwha and Glines Canyon, from the Elwha River. Removal of the dams reintroduced sediment stored in the reservoirs to the river, and the river moved much of this sediment to the coast. Several benthic tripods were instrumented with...
Categories: Data,
Data Release - Revised;
Types: Citation;
Tags: CMGP,
CONDUCTIVITY,
CTD,
CTD measurement,
CURRENT METERS,
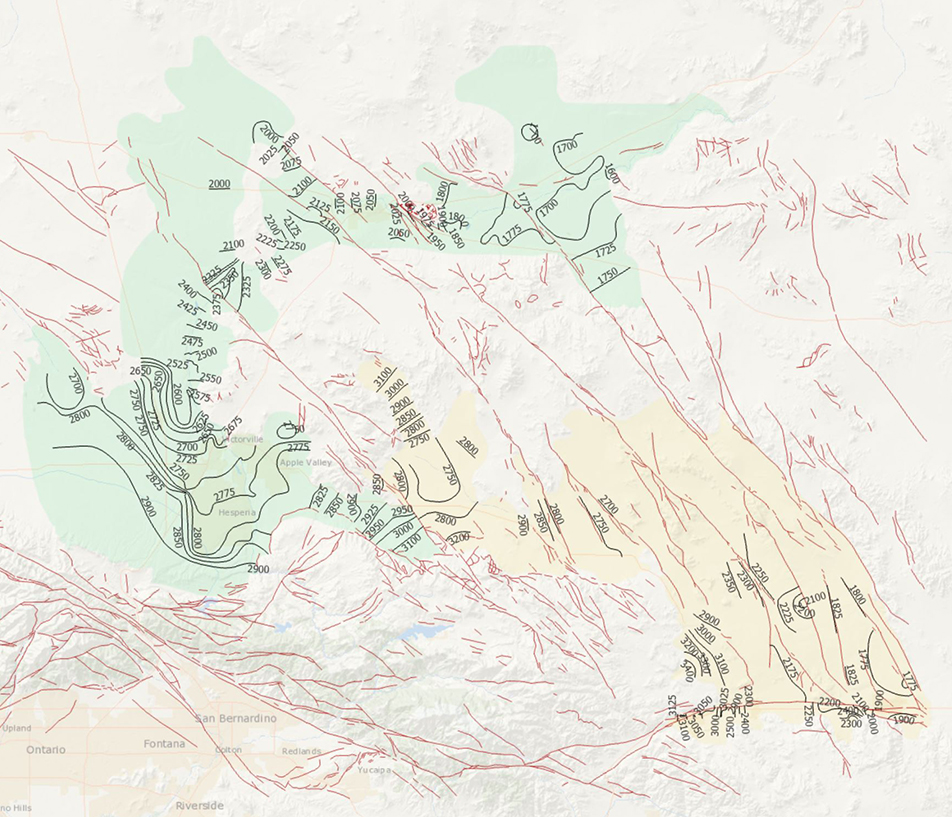
During 2014, the U.S. Geological Survey and other agencies made approximately 1,026 water-level measurements in the Mojave River and Morongo groundwater basins. These data document recent conditions and, when compared with previous data, changes in groundwater levels. A water-level contour map was drawn using data from about 610 wells, providing coverage for most of the basins. Twenty-four hydrographs show long-term (1930-2014) water-level conditions throughout the basins, and 9 short-term (1992 to 2014) hydrographs show the effects of recharge and discharge along the Mojave River. In addition, a water-level-change map was compiled to compare was compiled to compare the 2014 water levels to the 2012 water levels...
Categories: Data Release - Revised;
Tags: USGS,
USGS Science Data Catalog (SDC),
contours,
drainage basin,
ground water,
This data release includes 40Ar/39Ar data from the U.S. Geological Survey for samples from the Santa Cruz Basin, Arizona. Mineral samples were collected by Kenzie Turner and William Page from the upper Santa Cruz Basin, Arizona. Potassium-bearing mineral grains were separated from the bulk sample and analyzed by argon geochronology at the U.S. Geological Survey Argon Geochronology Laboratory in Denver, Colorado. The data provide age constraints on units in the relevant geologic mapping area.
Categories: Data,
Data Release - Revised;
Types: Downloadable,
Map Service,
OGC WFS Layer,
OGC WMS Layer,
Shapefile;
Tags: 40Ar/39Ar,
Argon Geochronology Laboratory,
Arizona,
GGGSC,
Geochemistry,
Hurricane Maria caused widespread landsliding throughout Puerto Rico in September 2017. While the majority of landslide inventories following the hurricane focused on mountainous regions underlain by igneous and volcaniclastic bedrock (Bessette-Kirton et al., 2017, 2019), here we fill an important knowledge gap and document the occurrence of landslides along the greater karst region on the northwest side of the island. To examine the extent and characteristics of landslides in this area, we mapped individual landslides in municipalities including Aguadilla, Aguada, Arecibo, Barceloneta, Bayamon, Camuy, Ciales, Corozal, Dorado, Florida, Hatillo, Isabela, Lares, Manati, Moca, Morovis, Quebradillas, Rincon, San Sebastian,...
This data release provides a map of the time-averaged shear-wave velocity in the upper 30 m (Vs30) for California using the method described by Thompson and others (2014). There are two adjustments to the algorithm described by Thompson and others (2014), which is built on the geology-based Vs30 map by Wills and Clahan (2006). In this data release, we use the Wills and others (2015) updated geology-based Vs30 map. The second change is that we have adjusted the kriging procedure so that measured Vs30 values do not affect the predictions across distinctly different geologic units. July 2022 Update (ver. 2.0) Resolution is now 3 arcseconds instead of 7.5 arcseconds Fixed a code error that prevented some of the Vs30...
Categories: Data,
Data Release - Revised;
Types: Downloadable,
GeoTIFF,
Map Service,
OGC WFS Layer,
OGC WMS Layer,
OGC WMS Service,
Raster;
Tags: California,
Earthquake Hazards Program,
GHSC,
Geologic Hazards Science Center,
USGS,
These data map in high detail surficial cross-sections of North Core Banks, a barrier island in Cape Lookout National Seashore, NC, in October 2022. U.S. Geological Survey field efforts are part of an interagency agreement with the National Park Service to monitor the recovery of the island from Hurricanes Florence (2018) and Dorian (2019). Three sites of outwash, overwash, and pond formation were targeted for extensive vegetation ground-truthing, sediment samples, bathymetric mapping with a remote-controlled surface vehicle, and uncrewed aerial systems (UAS) flights to collect multispectral imagery. Five semi-permanent ground control points were also installed and surveyed to act as control for additional aerial...
Categories: Data Release - Revised;
Tags: 5-band imagery,
Aerial Imaging and Mapping Group,
Atlantic Ocean,
CMHRP,
Cape Lookout,
Various water column variables, including salinity, dissolved inorganic nutrients, dissolved inorganic carbon, and radio-carbon isotopes were measured in samples collected using a Niskin-bottle rosette at selected depths from deepwater sites offshore the US Mid- and South Atlantic from September 2017 to April 2019. CTD (Conductivity Temperature Depth) data were also collected at each depth that a Niskin-bottle sample was collected and are presented along with the water sample data during the following five cruises: PC1704 (USGS field activity 2017-004-FA) in September 2017, ENG615 (USGS field activity 2018-024-FA) in June 2018, AT41 (USGS field activity 2018-042-FA) in August 2018, BMCC-2018 (USGS field activity...
Categories: Data,
Data Release - Revised;
Tags: Atlantic Ocean,
CMHRP,
CTD measurement,
Coastal and Marine Hazards and Resources Program,
Geochemistry,
In 2009, the Kootenai Tribe of Idaho released and implemented the Kootenai River Habitat Restoration Master Plan. This plan aimed to restore, enhance, and maintain the Kootenai River habitat and landscape to support and sustain habitat conditions for aquatic species and animal populations. In support of these restoration efforts, the U.S. Geological Survey, in cooperation with the Kootenai Tribe of Idaho, conducted high-resolution multibeam echosounder bathymetric surveys as a baseline bathymetric monitoring survey on the Kootenai River near Bonners Ferry, Idaho. Three channel patterns or reaches exist in the study area—braided, meander, and a transitional zone connecting the braided and meander reaches. Bathymetric...
Categories: Data Release - Revised;
Types: Map Service,
OGC WFS Layer,
OGC WMS Layer,
OGC WMS Service;
Tags: ASCII,
Bathymetry,
Bonners Ferry,
Geology,
Hypack,
|

|
