Filters: Extensions: ArcGIS REST Service (X)
383 results (11ms)|
Filters
Date Range
Extensions Types
Contacts
Categories Tag Types
|
The seven input models used to estimate the total influence of the human footprint. These models either explored how anthropogenic features influence wildlife populations via changes in habitat (road-induced dispersal of invasive plants, oil and gas developments, human induced fires, and anthropogenic habitat fragmentation) or predators densities (spatial distribution of domestic and synanthropic avian predators). The human footprint map is a composite of these seven models.
This web map contains the ESRI ArcGIS Online World Topographic Map service, (aka "the community basemap"). The World Topographic Map service is designed to be used as a basemap by GIS professionals and as a reference map by anyone. The service includes administrative boundaries, cities, water features, physiographic features, parks, landmarks, highways, roads, railways, airports, and buildings overlaid on land cover and s
Categories: Data;
Types: ArcGIS REST Map Service,
Map Service;
Tags: Administrative Area,
Airports,
Buildings,
Cities,
Highways,
This time-enabled map service depicts the infestation of the mountain pine beetle within Banff, Kootenay and Yoho National Parks between 1999 and 2007. It also contains reference boundaries for the parks, areas susceptible to the mountain pine beetle and areas of lodgepole pine.
Categories: Data;
Types: ArcGIS REST Map Service,
Map Service;
Tags: Alberta,
British Columbia,
Canada,
ESRI Canada,
Education,
A map depicting US Forest Service Administrative Boundaries data.
Categories: Data;
Types: ArcGIS REST Map Service,
Map Service;
Tags: Adminstrative,
Forest Service,
Forests,
Ranger Districs,
Regions
This map shows Census boundaries and other features on a simple, mostly white basemap. The map displays the 2009 TIGER data. This map is designed to complement colorful basemaps and thematic layers, such as Census demographics. It is intended for census experts and the general public alike. This map shows Census boundaries and other features on a simple, mostly white basemap. The map displays the 2009 TIGER data. This map is designed to complement colorful basemaps and thematic layers, such as Census demographics. It is intended for census experts and the general public alike. The map includes water features, railway, roads, and administrative boundaries (city and town limits, metropolitan statistical...
Categories: Data;
Types: ArcGIS REST Map Service,
Map Service;
Tags: Census,
Counties,
Population Density,
States
This map contains a data layer that depicts the simplified boundaries of lands and waters administered by the U.S. Fish and Wildlife Service (USFWS) in North America, U.S. Trust Territories and Possessions. It includes only lands that are held by fee or secondary title by USFWS. The primary source for this information is the USFWS Realty program. For more information the NWRS visit: http://www.fws.gov/refuges/ This map contains a data layer that depicts the simplified boundaries of lands and waters administered by the U.S. Fish and Wildlife Service (USFWS) in North America, U.S. Trust Territories and Possessions. It includes only lands that are held by fee or secondary title by USFWS. The primary source...
Categories: Data;
Types: ArcGIS REST Map Service,
Map Service;
Tags: Boundaries,
FWS,
NWRS,
National Wildlife Refuge System
In response to the Nisqually earthquake of 2001, DGER was awarded a grant by the Federal Emergency Management Agency and Washington Emergency Management Division to develop two types of earthquake hazard maps for every county in the state—liquefaction susceptibility maps, which outline areas where water-saturated sandy soil loses strength during earthquake shaking, and NEHRP (National Earthquake Hazards Reduction Program) site class maps, which outline areas where soils amplify ground shaking. The maps will be used by state and local governments to update existing hazard mitigation plans and to delineate geologically hazardous areas under the Growth Management Act. In response to the Nisqually earthquake of...
Categories: Data;
Types: ArcGIS REST Map Service,
Map Service;
Tags: Class,
DNR,
Geology,
Natural Resources,
Site,
This map service is an information surface which displays what percentage of the soil map unit is subject to water being ponded on the soil surface. Each soil map unit polygon falls into one of the following classes according to NRCS: 0-14%, 15-49%, 50-74% or 75-100%. Esri is providing NRCS SSURGO content here without modification except for some cartography and publishing necessary to facilitate esri user access to these data. Of course, esri will continue to update this inform This map service is an information surface which displays what percentage of the soil map unit is subject to water being ponded on the soil surface. Each soil map unit polygon falls into one of the following classes according to...
This map shows conservation element summaries within areas of potential near-term and long-term energy development. These summaries help highlight areas of potential conflict between conservation elements and energy development.
Categories: Data,
Map;
Types: ArcGIS REST Map Service,
Map Service;
Tags: Colorado Plateau,
potential conflicts,
potential development,
renewable energy,
transmission corridors
This map shows potential areas with high terrestrial biodiversity from TNC Ecoregional Portfolio Core dataset.
Categories: Data,
Map;
Types: ArcGIS REST Map Service,
Map Service;
Tags: Colorado Plateau,
Terrestrial Biodiversity
This map shows the current distribution of major invasive vegetation species (primarily cheatgrass and tamarisk), and predicted near-term future distribution of these species. Current distribution was derived from LANDFIRE EVT v1.1, NatureServe National Landcover v2.7, Early Season Invasives (USGS), Predicted Tamarisk Probability (USGS), and mapped areas of tamarisk. Predicted future distribution included these areas in addition to the invasive vegetation class from the LANDFIRE Succession Class v1.0 dataset.
Categories: Data,
Map;
Types: ArcGIS REST Map Service,
Map Service;
Tags: Colorado Plateau,
invasive species,
potential future encroachment
This map shows the potential current distribution of white-tailed prairie dog, in the context of current and near-term terrestrial intactness and long-term potential for climate change and energy development.
Categories: Data,
Map;
Types: ArcGIS REST Map Service,
Map Service;
Tags: Colorado Plateau,
White-Tailed Prairie Dog
This map shows areas of high current, near-term, and long-term potential landscape development, based on factors such as urban areas, agriculture, roads, and energy development.
Categories: Data,
Map;
Types: ArcGIS REST Map Service,
Map Service;
Tags: Colorado Plateau,
change agents,
climate change,
rapid ecoregional assessment
This map shows the major terrestrial ecosystems from LANDFIRE EVT (v1.1) and NatureServe National Landcover (v2.7).
Categories: Data,
Map;
Types: ArcGIS REST Map Service,
Map Service;
Tags: Colorado Plateau,
terrestrial ecosystems
This map shows the location of herd management areas (HMAs).
Categories: Data,
Map;
Types: ArcGIS REST Map Service,
Map Service;
Tags: Colorado Plateau,
horse management areas
This map shows Class I Federal PSD Areas using features selected from the CBI Protected Areas Database. Non-attainment areas are not mapped.
Categories: Data,
Map;
Types: ArcGIS REST Map Service,
Map Service;
Tags: Class I PSD areas,
Colorado Plateau,
non-attainment areas
This map shows the potential current distribution of Golden Eagle, in the context of current and near-term terrestrial intactness and long-term potential for climate change and energy development.
Categories: Data,
Map;
Types: ArcGIS REST Map Service,
Map Service;
Tags: Colorado Plateau,
Golden Eagle
This map service was created to assemble oil and gas well information for a comprehensive inventory of energy data pertinent to the Wyoming Landscape Conservation Initiative decision-making process. These data are available as online resources for scientists, resource managers engaged in the Initiative, and other researchers. The GIS data and map documents created for this study are available for interactive analysis and/or download at the Energy Geoscience Center website.
Categories: Data;
Types: ArcGIS REST Map Service,
Map Service,
OGC WFS Layer,
OGC WMS Layer,
OGC WMS Service
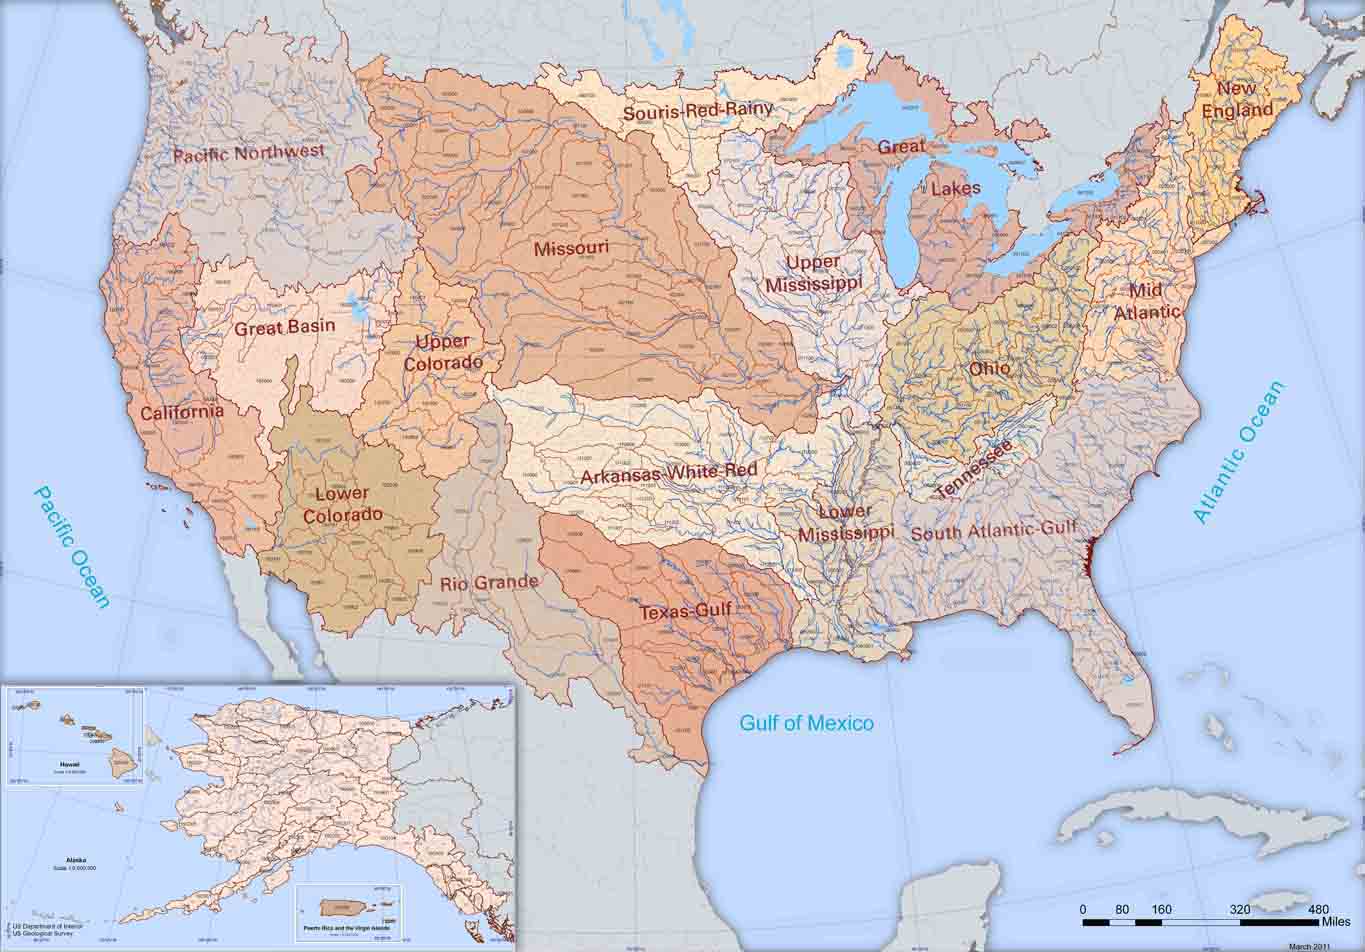
The Watershed Boundary Dataset (WBD) from The National Map (TNM) defines the perimeter of drainage areas formed by the terrain and other landscape characteristics. The drainage areas are nested within each other so that a large drainage area, such as the Upper Mississippi River, will be composed of multiple smaller drainage areas, such as the Wisconsin River. Each of these smaller areas can further be subdivided into smaller and smaller drainage areas. The WBD uses six different levels in this hierarchy, with the smallest averaging about 30,000 acres. The WBD is made up of polygons nested into six levels of data respectively defined by Regions, Subregions, Basins, Subbasins, Watersheds, and Subwatersheds. For additional...
This shapefile contains fish habitat condition index (HCI) scores as well as specific disturbance indices for 6th level Hydrologic Unit Code (HUC12) watersheds of the Watershed Boundary Dataset. The source datasets compiled and attributed to spatial units were identified as being: (1) meaningful for assessing fluvial fish habitat; (2) consistent across the entire study area in the way that they were assembled; (3) broadly representative of conditions in the past 10 years, and (4) of sufficient spatial resolution that they could be used to make valid comparisons among HUC12 units. In this data set, variable summaries are linked to HUC12 watersheds developed for the Watershed Boundary Dataset downloaded on March 18,...
Categories: Data;
Types: ArcGIS REST Map Service,
Map Service;
Tags: 2015 National Assessment,
2015 National Assessment,
DataProduct,
Direct habitat alteration,
Environmental condition,
|

|
