Filters: System Type: Data Release (X) > Categories: NOT Data Release - In Progress (X) > Tags: {"scheme":"Geographic Names Information System"} (X)
2,113 results (122ms)|
Filters
Date Range
Extensions Types
Contacts
Categories Tag Types Tags (with Scheme=Geographic Names Information System) |
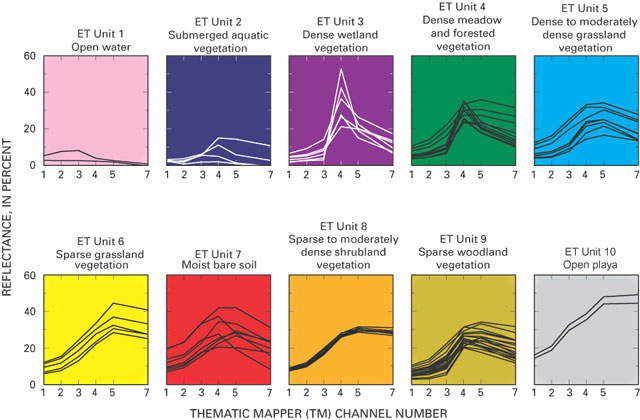
These data were released prior to the October 1, 2016 effective date for the USGS’s policy dictating the review, approval, and release of scientific data as referenced in USGS Survey Manual Chapter 502.8 Fundamental Science Practices: Review and Approval of Scientific Data for Release. The raster-based classification of evapotranspiration (ET) units is for nine major discharge areas in the Death Valley regional flow system. The ET units delineate general areas of similar vegetation and soil-moisture conditions. Classifications were derived from Landsat Thematic Mapper imagery data acquired June 13, 1992; Sept. 1, 1992; and June 21, 1989.
These data were released prior to the October 1, 2016 effective date for the USGS’s policy dictating the review, approval, and release of scientific data as referenced in USGS Survey Manual Chapter 502.8 Fundamental Science Practices: Review and Approval of Scientific Data for Release. This data set contains the main stem of the Humboldt River as defined by Humboldt Project personnel of the U.S. Geological Survey Nevada District, 2001. The data set was digitized on screen using digital orthophoto quadrangles from 1994.

These data were released prior to the October 1, 2016 effective date for the USGS’s policy dictating the review, approval, and release of scientific data as referenced in USGS Survey Manual Chapter 502.8 Fundamental Science Practices: Review and Approval of Scientific Data for Release. These data represent the thickness, in feet, of the upper Fort Union aquifer in the Williston structural basin. The data are presented as ASCII text files that can be converted to continuous raster format.

These data were released prior to the October 1, 2016 effective date for the USGS’s policy dictating the review, approval, and release of scientific data as referenced in USGS Survey Manual Chapter 502.8 Fundamental Science Practices: Review and Approval of Scientific Data for Release. These data represent the thickness, in feet, of the Lower Hell Creek aquifer in the Williston structural basin. The data are presented as ASCII text files that can be converted to continuous raster format.

These data were released prior to the October 1, 2016 effective date for the USGS’s policy dictating the review, approval, and release of scientific data as referenced in USGS Survey Manual Chapter 502.8 Fundamental Science Practices: Review and Approval of Scientific Data for Release. These data represent the altitude, in feet above North American Vertical Datum of 1988 (NAVD88), of the basal confining unit in the Powder River basin. The data are presented as ASCII text files that can be converted to continuous raster format.

A three-dimensional groundwater flow model (MODFLOW2000) of the Atlantic Coastal Plain aquifers and confining units was developed to evaluate groundwater availability and to forecast the potential effects of climate change on groundwater levels in the study area. Two existing groundwater flow models that simulated flow and water use in the Coastal Plain aquifers of North Carolina (NC), South Carolina (SC), and parts of Georgia and Virginia, were combined and updated to provide a single model. Revisions to the model incorporated additional hydrogeologic, geologic, water-level, and water-use data and hydrogeologic inconsistencies at the NC-SC border reconciled since the development of the previous models. The new...

A groundwater-flow model was developed for the Bad River Watershed and surrounding area by using the U.S. Geological Survey (USGS) finite-difference code MODFLOW–NWT. The model simulates steady-state groundwater-flow and base flow in streams by using the streamflow routing (SFR) package. The model was calibrated to groundwater levels and base flows obtained from the USGS National Water Information System (NWIS) database, and groundwater levels obtained from the Wisconsin Department of Natural Resources and Bad River Band well-construction databases. Calibration was performed via nonlinear regression by using the parameter-estimation software suite PEST.

The domain of the model is as follows: Row River from Dorena dam to the confluence with the Coast Fork; Coast Fork from Cottage Grove dam to the confluence with the Middle Fork; Silk Creek from River Mile 1.7 to the confluence with the Coast Fork. The basis for these features is the Willamette Flood Insurance Study – Phase One (2013). The hydraulics and hydrology for the FIS were reused in the production of these polygons; the reports and information associated with the FIS are applicable to this product. The Digital Elevation Model (DEM) utilized for the Willamette FIS submittal was produced by combining multiple overlapping topographic surveys for the Middle Fork and Coast Fork of the Willamette River. This DEM...
These data were released prior to the October 1, 2016 effective date for the USGS’s policy dictating the review, approval, and release of scientific data as referenced in USGS Survey Manual Chapter 502.8 Fundamental Science Practices: Review and Approval of Scientific Data for Release. The raster-based classification of evapotranspiration (ET) units is for nine major discharge areas in the Death Valley regional flow system. The ET units delineate general areas of similar vegetation and soil-moisture conditions. Classifications were derived from Landsat Thematic Mapper imagery data acquired June 13, 1992; Sept. 1, 1992; and June 21, 1989.

These data were released prior to the October 1, 2016 effective date for the USGS’s policy dictating the review, approval, and release of scientific data as referenced in USGS Survey Manual Chapter 502.8 Fundamental Science Practices: Review and Approval of Scientific Data for Release. These data represent the extent of the middle Fort Union hydrogeologic unit in the Powder River and Williston structural basins.

A regional groundwater-flow model and particle-tracking program were used to delineate areas contributing groundwater to coastal and freshwater bodies and to estimate travel times from the water table to saline water bodies under average conditions from 1968 to 1983 on Long Island, New York. The coastal waters of Long Island are important economic and recreational resources for the region. The coastal water bodies receive freshwater from inflow of both surface water and groundwater, in addition to tidal exchanges of saltwater. Excessive nitrogen inputs associated with development and urbanization in the freshwater recharge areas to coastal water bodies can adversely affect marine and estuarine ecosystems. The results...

These data were released prior to the October 1, 2016 effective date for the USGS’s policy dictating the review, approval, and release of scientific data as referenced in USGS Survey Manual Chapter 502.8 Fundamental Science Practices: Review and Approval of Scientific Data for Release. This data set consists of digital water-level elevation contours for the alluvial and terrace deposits along the Cimarron River in northwestern Oklahoma during 1985-86. Ground water in 1,305 square miles of Quaternary-age alluvial and terrace deposits along the the Cimarron River from Freedom to Guthrie is an important source of water for irrigation, industrial, municipal, stock, and domestic supplies. Alluvial and terrace deposits...

These data were released prior to the October 1, 2016 effective date for the USGS’s policy dictating the review, approval, and release of scientific data as referenced in USGS Survey Manual Chapter 502.8 Fundamental Science Practices: Review and Approval of Scientific Data for Release. This 30-meter data set represents land use and land cover for the conterminous United States for the 2001 time period. The data have been arranged into four tiles to facilitate timely display and manipulation within a Geographic Information System (see https://www.sciencebase.gov/catalog/file/get/631405cad34e36012efa3299?name=nlcd01-partitions.jpg). The National Land Cover Data Set for 2001 was produced through a cooperative project...

These data were released prior to the October 1, 2016 effective date for the USGS’s policy dictating the review, approval, and release of scientific data as referenced in USGS Survey Manual Chapter 502.8 Fundamental Science Practices: Review and Approval of Scientific Data for Release. This data set consists of digitized aquifer boundaries for the Rush Springs aquifer in western Oklahoma. This area encompasses all or part of Blaine, Caddo, Canadian, Comanche, Custer, Dewey, Grady, Stephens, and Washita Counties. Mark F. Becker (U.S. Geological Survey, written commun., 1997) created an aquifer boundary data set that represented hydrologic boundaries needed to simulate the ground-water flow in the Rush Springs aquifer...

These data were released prior to the October 1, 2016 effective date for the USGS’s policy dictating the review, approval, and release of scientific data as referenced in USGS Survey Manual Chapter 502.8 Fundamental Science Practices: Review and Approval of Scientific Data for Release. The U.S. Geological Survey (USGS), in cooperation with the Lewis and Clark Natural Resources District (NRD), Lower Elkhorn NRD, Lower Loup NRD, Lower Platte North NRD, Lower Niobrara NRD, Middle Niobrara NRD, Upper Elkhorn NRD, and Upper Loup NRD, have agreed to cooperatively study water resources from prior to the beginning of irrigation development to 2005 in the Elkhorn-Loup Model (ELM) area using a ground-water-flow model. The...

These data were released prior to the October 1, 2016 effective date for the USGS’s policy dictating the review, approval, and release of scientific data as referenced in USGS Survey Manual Chapter 502.8 Fundamental Science Practices: Review and Approval of Scientific Data for Release. The water-budget components geodatabase contains selected data from maps in the, "Selected Approaches to Estimate Water-Budget Components of the High Plains, 1940 through 1949 and 2000 through 2009" report (Stanton and others, 2011). Data were collected and synthesized from existing climate models including the Parameter-Elevation Regressions on Independent Slopes Model (PRISM) (Daly and others, 1994), and the Snow accumulation and...

These data were released prior to the October 1, 2016 effective date for the USGS’s policy dictating the review, approval, and release of scientific data as referenced in USGS Survey Manual Chapter 502.8 Fundamental Science Practices: Review and Approval of Scientific Data for Release. In 2006, a cooperative study was established to compile reliable data describing groundwater and surface-water interactions in the Elkhorn and Loup River Basins. The purpose of the study was to address state legislation that requires a sustainable balance between long term water supplies and uses of surface water and groundwater. A groundwater-flow model [hereinafter referred to as the Elkhorn-Loup Model (ELM)] was constructed as...

A three-dimensional groundwater flow model, MODFLOW-NWT with the SWI2 module, was developed to provide a better understanding of the fresh groundwater system of Assateague Island, Maryland and Virginia. Groundwater flow on Assateague Island was simulated to evaluate the effects of sea-level rise and changes in recharge on the depth to freshwater below the land surface, changes in freshwater discharge, and the depth of the freshwater/saltwater interface. The model was calibrated to average 2014-15 hydrologic conditions and vegetation. The model also simulated the movement of the freshwater- seawater interface for three sea-level rise scenarios.This USGS data release contains all of the input and output files for...

These data were released prior to the October 1, 2016 effective date for the USGS’s policy dictating the review, approval, and release of scientific data as referenced in USGS Survey Manual Chapter 502.8 Fundamental Science Practices: Review and Approval of Scientific Data for Release. This data set consists of digitized polygons of constant recharge values for the Vamoosa-Ada aquifer, in east-central Oklahoma. The Vamoosa-Ada aquifer is an important source of water that underlies about 2,320-square miles of parts of Osage, Pawnee, Payne, Creek, Lincoln, Okfuskee, and Seminole Counties. Approximately 75 percent of the water withdrawn from the Vamoosa-Ada aquifer is for municipal use. Rural domestic use and water...

These data were released prior to the October 1, 2016 effective date for the USGS’s policy dictating the review, approval, and release of scientific data as referenced in USGS Survey Manual Chapter 502.8 Fundamental Science Practices: Review and Approval of Scientific Data for Release. This subset of a Landsat-7 image shows part of the upper Klamath Basin. The original images were obtained from the U.S. Geological Survey Earth Resources Observation and Science Center (EROS). EROS is responsible for archive management and distribution of Landsat data products. The Landsat-7 satellite is part of an ongoing mission to provide quality remote sensing data in support of research and applications activities. The launch...
|

|
