Filters: Tags: {"scheme":"Data Basin"} (X) > partyWithName: Conservation Biology Institute (X)
7,076 results (21ms)|
Filters
Date Range
Tags (with Scheme=Data Basin) |

This product is one of a set of mapped model simulation results generated for a project called "Global Climate Change and California: Potential Implications for Ecosystems, Health, and the Economy". The project was conducted by the Electrical Power Research Institute (EPRI) and funded by the California Energy Commission's Public Interest Energy Research (PIER) Program. The project was the most detailed study ever undertaken on the potential effect of climate change on California. The work examined a broad array of potentially affected sectors as well as the interactions between climate change and increased population, economic growth, and technological change. It considered a wide range of climate change scenarios,...
This dataset is an extraction from PAD-US 1.1 (CBI Edition), by National Parks management designation. The PAD-US 1.1 (CBI Edition) data set portrays the nation's protected areas with a standardized spatial geometry and numerous valuable attributes on land ownership, management designations, and conservation status (using national GAP and international IUCN coding systems). The PAD-US 1.1 (CBI Edition) defines protected areas to include all lands dedicated to the preservation of biological diversity and to other natural, recreation and cultural uses, and managed for these purposes through legal or other effective means (adapted from IUCN definition). The database represents the full range of conservation designations...

Soil residual water corresponds to the model variable "total streamflow." In the model MC1, this is calculated (in cm of water) as the water flowing through the soil profile below the last soil layer (streamflow), water leached into the subsoil (baseflow) and also includes runoff. The output is presented here as a monthly average. Soil residual water is part of the model output from Brendan Rogers' MS thesis work. Brendan used the vegetation model MC1 to simulate vegetation dynamics, associated carbon and nitrogen cycle, water budget and wild fire impacts across the western 2/3 of the states of Oregon and Washington using climate input data from the PRISM group (Chris Daly, OSU) at a 30arc second (800m) spatial...

Soil residual water corresponds to the model variable "total streamflow." In the model MC1, this is calculated (in cm of water) as the water flowing through the soil profile below the last soil layer (streamflow), water leached into the subsoil (baseflow) and also includes runoff. The output is presented here as a monthly average. Soil residual water is part of the model output from Brendan Rogers' MS thesis work. Brendan used the vegetation model MC1 to simulate vegetation dynamics, associated carbon and nitrogen cycle, water budget and wild fire impacts across the western 2/3 of the states of Oregon and Washington using climate input data from the PRISM group (Chris Daly, OSU) at a 30arc second (800m) spatial...

Soil residual water corresponds to the model variable "total streamflow." In the model MC1, this is calculated (in cm of water) as the water flowing through the soil profile below the last soil layer (streamflow), water leached into the subsoil (baseflow) and also includes runoff. The output is presented here as a monthly average. Soil residual water is part of the model output from Brendan Rogers' MS thesis work. Brendan used the vegetation model MC1 to simulate vegetation dynamics, associated carbon and nitrogen cycle, water budget and wild fire impacts across the western 2/3 of the states of Oregon and Washington using climate input data from the PRISM group (Chris Daly, OSU) at a 30arc second (800m) spatial...

Soil residual water corresponds to the model variable "total streamflow." In the model MC1, this is calculated (in cm of water) as the water flowing through the soil profile below the last soil layer (streamflow), water leached into the subsoil (baseflow) and also includes runoff. The output is presented here as a monthly average. Soil residual water is part of the model output from Brendan Rogers' MS thesis work. Brendan used the vegetation model MC1 to simulate vegetation dynamics, associated carbon and nitrogen cycle, water budget and wild fire impacts across the western 2/3 of the states of Oregon and Washington using climate input data from the PRISM group (Chris Daly, OSU) at a 30arc second (800m) spatial...

Soil residual water corresponds to the model variable "total streamflow." In the model Mc1, this is calculated (in cm of water) as the water flowing through the soil profile below the last soil layer (streamflow), Water leached in the subsoil (baseflow) and also includes runoff. the output is prsented here as a monthly average. Soil residual water is part of the model output from Brendan Rogers' MS thesis work. Brendan used the vegetation model MC1 to simulate vegetation dynamics, associated carbon and nitrogen cycle, water budget and wild fire impacts across the western 2/3 of the states of Oregon and Washington using climate input data from the PRISM group (Chris Daly, OSU) at a 30arc second (800m) spatial grain....
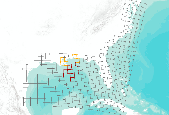
A 75,000 x 75,000 meter grid covering the Gulf of Mexico, created to identify possible areas of landfall of oil from the Deepwater Horizon oil spill. Using oil spill trajectories produced by the Ocean Circulation Group and the Optical Oceanography Laboratory at the College of Marine Science, University of South Florida, and protected areas data catalogued in PAD-US (CBI Edition) , we provide a preliminary attempt to identify ecological resources that may be affected by the spill. By overlaying these projected trajectories on a standardized grid, we can select areas that may contain oil from the spill, or are likely to contain oil in the future. We then identify protected areas that are likely to be most directly...

This dataset depicts the Level I ecological regions of North America, as compiled by the Commission for Environmental Cooperation (CEC). These draft files of of Level I, II, and III ecological regions of North America are an update and revision of files developed by Canada, the United States, and Mexico in the late 1990's in a cooperative project for the Commission for Environmental Cooperation (CEC 1997). The CEC was created under the North American Agreement on Environmental Cooperation (NAAEC) to address regional environmental concerns, help prevent potential trade and environmental conflicts and promote the effective enforcement of environmental law. The Agreement complements the environmental provisions established...

This dataset represents actual and predicted suitable habitat for Nyssa sylvatica var. biflora (swamp tupelo, species code 694) in the Eastern United States as measured by importance value based on data obtained from the Forest Inventory and Analysis (FIA) project, current climate conditions, and future climate projections. This summary unit of this dataset is a 20 by 20 kilometer cell. The actual importance value (IV) was calculated based on the number of stems and basal area of a given tree species relative to other tree species on a plot using about 100,000 FIA plots (representing nearly 3 million tree records) in the 37 states within the United States east of the 100th meridian. These importance values were...

These data identify the areas where final critical habitat has been mapped by the USFWS for plant species in the eastern United States. These data were compiled by the Conservation Biology Institute (CBI) from a series of individual shapefiles published by the USFWS (http://criticalhabitat.fws.gov/). For more information on the process for mapping the critical habitat for each species, please see the metadata for each species listed on the USFWS web site. Critical habitat designations have not been made for all listed endangered species. Where critical habitat has been mapped, this dataset only contains those species for which GIS datasets have been made publicly available. Other critical habitat maps exist for...

This product is one of a set of mapped model simulation results generated for a project called “Global Climate Change and California: Potential Implications for Ecosystems, Health, and the Economy”. The project was conducted by the Electrical Power Research Institute (EPRI) and funded by the California Energy Commission’s Public Interest Energy Research (PIER) Program. The project was the most detailed study ever undertaken on the potential effect of climate change on California. The work examined a broad array of potentially affected sectors as well as the interactions between climate change and increased population, economic growth, and technological change. It considered a wide range of climate change scenarios,...

The dynamic vegetation model MC2 used a suite of climate futures from the Coupled Model Intercomparison Project (CMIP5, http://cmip-pcmdi.llnl.gov/cmip5/ downscaled using a fairly new statistical downscaling approach (Abatzoglou 2011), Multivariate Adaptive Constructed Analogs (MACA), over the western US. The vegetation model was run on the NASA Earth Exchange (NEX) platform at 4km resolution for 2 representative concentration pathways (RCPs) 8.5 and 4.5 (Moss et al. 2010, van Vuuren et. al 2011). Representative Concentration Pathway define a specific emissions trajectory and subsequent radiative forcing. Radiative forcing is a measure of the influence a factor has in altering the balance of incoming and outgoing...

This dataset represents actual and predicted suitable habitat for Quercus ellipsoidalis (northern pin oak, species code 809) in the Eastern United States as measured by importance value based on data obtained from the Forest Inventory and Analysis (FIA) project, current climate conditions, and future climate projections. This summary unit of this dataset is a 20 by 20 kilometer cell. The actual importance value (IV) was calculated based on the number of stems and basal area of a given tree species relative to other tree species on a plot using about 100,000 FIA plots (representing nearly 3 million tree records) in the 37 states within the United States east of the 100th meridian. These importance values were summarized...

The dynamic vegetation model MC2 used a suite of climate futures from the Coupled Model Intercomparison Project (CMIP5, http://cmip-pcmdi.llnl.gov/cmip5/ downscaled using a fairly new statistical downscaling approach (Abatzoglou 2011), Multivariate Adaptive Constructed Analogs (MACA), over the western US. The vegetation model was run on the NASA Earth Exchange (NEX) platform at 4km resolution for 2 representative concentration pathways (RCPs) 8.5 and 4.5 (Moss et al. 2010, van Vuuren et. al 2011). Representative Concentration Pathway define a specific emissions trajectory and subsequent radiative forcing. Radiative forcing is a measure of the influence a factor has in altering the balance of incoming and outgoing...

The dynamic vegetation model MC2 used a suite of climate futures from the Coupled Model Intercomparison Project (CMIP5, http://cmip-pcmdi.llnl.gov/cmip5/ downscaled using a fairly new statistical downscaling approach (Abatzoglou 2011), Multivariate Adaptive Constructed Analogs (MACA), over the western US. The vegetation model was run on the NASA Earth Exchange (NEX) platform at 4km resolution for 2 representative concentration pathways (RCPs) 8.5 and 4.5 (Moss et al. 2010, van Vuuren et. al 2011). Representative Concentration Pathway define a specific emissions trajectory and subsequent radiative forcing. Radiative forcing is a measure of the influence a factor has in altering the balance of incoming and outgoing...

The dynamic vegetation model MC2 used a suite of climate futures from the Coupled Model Intercomparison Project (CMIP5, http://cmip-pcmdi.llnl.gov/cmip5/ downscaled using a fairly new statistical downscaling approach (Abatzoglou 2011), Multivariate Adaptive Constructed Analogs (MACA), over the western US. The vegetation model was run on the NASA Earth Exchange (NEX) platform at 4km resolution for 2 representative concentration pathways (RCPs) 8.5 and 4.5 (Moss et al. 2010, van Vuuren et. al 2011). Representative Concentration Pathway define a specific emissions trajectory and subsequent radiative forcing. Radiative forcing is a measure of the influence a factor has in altering the balance of incoming and outgoing...

These data identify, in general, the areas where final critical habitat for Castilleja cinerea (Ash-gray Indian paintbrush) occur.

The MAPSS team together with long-time collaborator Chris Daly of the Spatial Climate Analysis Service is using Daly's PRISM model to produce high-resolution data grids of observed fire weather. The PRISM model produces interpolations of weather station data that are sensitive to topography, which is especially important in the complex, fire-prone terrain of the mountainous West. Input station data are gathered primarily from the National Weather Service (NWS) Cooperative Observer Program (COOP) and U.S. Department of Agriculture-Natural Resources Conservation Service (USDA-NRCS) SNOTEL networks. For mapped examples of the PRISM-generated historical weather data grids see the Spatial Climate Analysis Service's Web...

The integrity of Amazon forests are currently threatened by climate change, deforestation, and fire. However, it is unclear how these agents of change interact over large spatial and temporal domains and reducing this uncertainty is important for projecting changes in carbon stocks and species biogeography, and could better inform continental scale conservation programs. With this in mind, aboveground biomass and tree cover data were produced using the dynamic global vegetation model, LPJmL, with 9 different global climate models (using the SRES A2 emissions storyline) and 2 different deforestation scenarios (from Soares et al.). The existing fire module was modified to include 'escaped fire' associated with deforestation,...
|

|
