Filters: Tags: {"type":"Place","name":"united states"} (X) > Types: ArcGIS REST Map Service (X)
121 results (122ms)|
Filters
Date Range
Extensions (Less)
Types (Less)
Contacts (Less)
Categories (Less) Tag Schemes
|
GAP distribution models represent the areas where species are predicted to occur based on habitat associations. GAP distribution models are the spatial arrangement of environments suitable for occupation by a species. In other words, a species distribution is created using a deductive model to predict areas suitable for occupation within a species range. To represent these suitable environments, GAP compiled existing GAP data, where available, and compiled additional data where needed. Existing data sources were the Southwest Regional Gap Analysis Project (SWReGAP) and the Southeast Gap Analysis Project (SEGAP) as well as a data compiled by Sanborn Solutions and Mason, Bruce and Girard. Habitat associations were...
Categories: Data;
Types: ArcGIS REST Map Service,
Map Service;
Tags: Biodiversity,
Conservation,
GAP,
Gap Analysis,
Species Distribution,
The Critical Minerals in Archived Mine Samples Database (CMDB) contains chemistry and geologic information for historic ore and ore-related rock samples from mineral deposits in the United States. In addition, the database contains samples from archetypal deposits from 27 other countries in North America, South America, Asia, Africa and Europe. Samples were obtained from archived ore collections under the U.S. Geological Survey's project titled "Quick Assessment of Rare and Critical Metals in Ore Deposits: A National Assessment" (2008 to 2013) in an effort to begin an assessment of the Nations' previously mined ore deposits for critical minerals. Mineralized and altered rock samples were provided by the Colorado...
Categories: Data;
Types: ArcGIS REST Map Service,
ArcGIS Service Definition,
Downloadable,
Map Service,
OGC WFS Layer,
OGC WMS Layer,
Shapefile;
Tags: Alaska,
Argentina,
Arizona,
Arkansas,
Australia,
The U.S. Geological Survey (USGS) has been engaged in airborne electromagnetics (AEM) since the 1970s, playing a role in the development of early acquisition systems, developing calibration methods, refining standards for data acquisition, improving data processing, modeling, and interpretation methods, and expanding the range of AEM applications. However, USGS AEM survey visibility and data accessibility has not advanced as rapidly as our use of the technique. This data release catalogs AEM surveys in the United States that have contributed to studies under USGS programs including Water, Geologic Mapping, Minerals, Energy, Environmental Health, Ecosystems, Hazards, and Climate. This dataset contains locations for...
Categories: Data;
Types: ArcGIS REST Map Service,
ArcGIS Service Definition,
Downloadable,
Map Service;
Tags: Alabama,
Arizona,
Arkansas,
California,
Colorado,
The Species Richness Maps included here are based on the Gap Analysis Project (GAP) habitat maps, which are predictions of the spatial distribution of suitable environmental and land cover conditions within the United States for individual species. Individual species habitat distribution models were summed to create the total richness for each vertebrate taxa. The summing process was coded in Python 2.7 and employed the arcpy module for geoprocessing steps. The code is documented in the log file which is included in the Sciencebase item along with the richness data for each taxa (See processing steps for file names and sciencebase urls). Mapped habitat distribution areas represent places where the environment is...
Categories: Data;
Types: ArcGIS REST Map Service,
Map Service;
Tags: United States,
biodiversity,
biota,
conservation,
gap analysis,
This data set contains shoreline rate of change statistics for New York State coastal wetlands. Analysis was performed using the Digital Shoreline Analysis System (DSAS), created by U.S. Geological Survey, version 5.0, an extension for ArcMap. A reference baseline was used as the originating point for orthogonal transects cast by the DSAS software. The transects intersect each polyline vector shoreline establishing intersection measurement points, which were then used to calculate the rates of change. End-point rates, calculated by dividing the distance of shoreline movement by the time elapsed between the oldest and the most recent shoreline, were generated for wetlands where fewer than three historic shorelines...
Categories: Data;
Types: ArcGIS REST Map Service,
ArcGIS Service Definition,
Downloadable,
Map Service;
Tags: Digital Shoreline Analysis System,
End-Point Rate,
Geography,
Geomorphology,
Great South Bay,
A mineral resource assessment was performed by the U.S. Geological Survey (USGS) to assess the potential of undiscovered skarn-hosted tungsten resources in the Northern Rocky Mountain region of eastern Idaho and western Montana. This region has seen moderate tungsten trioxide (WO3) production in the past from a variety of mineralization styles including skarn, vein and replacement, and wolframite-quartz veins. The geology of the area is dominated by large plutons of Cretaceous to Tertiary age, emplaced into a belt of sedimentary rock ranging from Mesoproterozoic to Permian age, and affected by tectonism related to the Sevier and later Laramide orogenies. Known tungsten (W) skarn mineral sites are associated with...
Categories: Data;
Types: ArcGIS REST Map Service,
ArcGIS Service Definition,
Downloadable,
Map Service;
Tags: Ashton,
Bald Mountain,
Beaverhead County,
Bitterroot Range,
Boise County,
Sandy ocean beaches are a popular recreational destination, often surrounded by communities containing valuable real estate. Development is on the rise despite the fact that coastal infrastructure is subjected to flooding and erosion. As a result, there is an increased demand for accurate information regarding past and present shoreline changes. To meet these national needs, the Coastal and Marine Geology Program of the U.S. Geological Survey (USGS) is compiling existing reliable historical shoreline data along open-ocean sandy shores of the conterminous United States and parts of Alaska and Hawaii under the National Assessment of Shoreline Change project.There is no widely accepted standard for analyzing shoreline...
Categories: Data;
Types: ArcGIS REST Map Service,
ArcGIS Service Definition,
Downloadable,
Map Service;
Tags: Accretion,
CMGP,
Coastal and Marine Geology Program,
Columbia River,
DSAS,
Database for the Geologic Map of the Bonanza Caldera Area, Northeastern San Juan Mountains, Colorado
The San Juan Mountains in southwestern Colorado have long been recognized as a site of exceptionally voluminous mid-Tertiary volcanism, including at least 24 major ignimbrite sheets (each 150-5,000 km3) and associated caldera structures active at 33-23 Ma. More recent volcanologic and petrologic studies in the San Juan region have focused mainly on several ignimbrite-caldera systems: the southeastern area (Platoro complex), western calderas (Uncompahgre-Silverton-Lake City), the central cluster (La Garita-Creede calderas). The northeast San Juan region that was far less studied until recently occupies a transition between earlier volcanism in central Colorado and the larger-volume younger ignimbrite-caldera foci...
Categories: Data;
Types: ArcGIS REST Map Service,
ArcGIS Service Definition,
Downloadable,
Map Service;
Tags: Bonanza,
Colorado,
North America,
Saguache,
USGS Science Data Catalog (SDC),
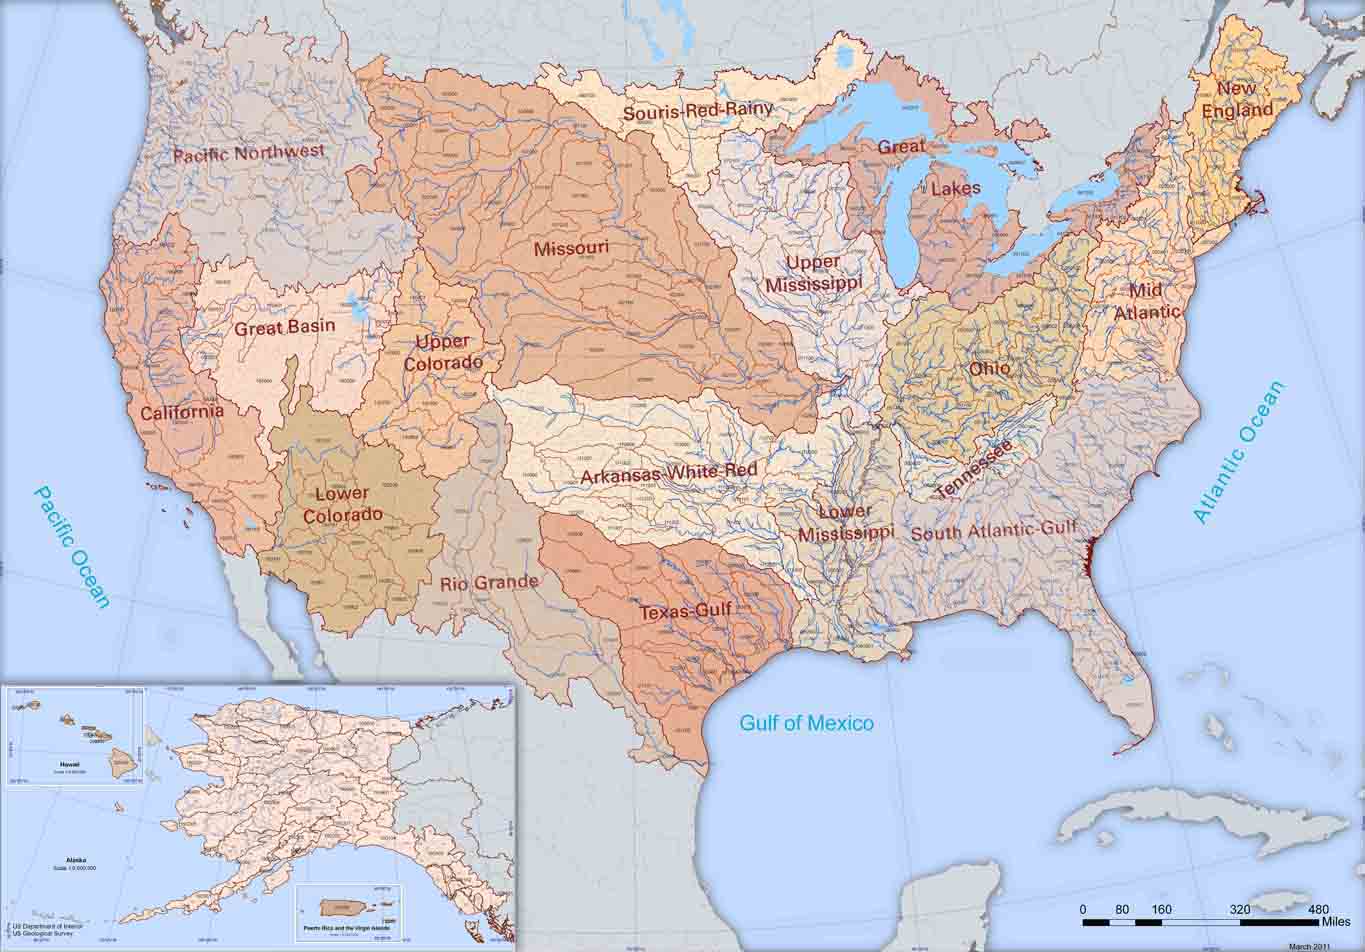
The Watershed Boundary Dataset (WBD) from The National Map (TNM) defines the perimeter of drainage areas formed by the terrain and other landscape characteristics. The drainage areas are nested within each other so that a large drainage area, such as the Upper Mississippi River, will be composed of multiple smaller drainage areas, such as the Wisconsin River. Each of these smaller areas can further be subdivided into smaller and smaller drainage areas. The WBD uses six different levels in this hierarchy, with the smallest averaging about 30,000 acres. The WBD is made up of polygons nested into six levels of data respectively defined by Regions, Subregions, Basins, Subbasins, Watersheds, and Subwatersheds. For additional...
As part of the Hurricane Sandy Science Plan, the U.S. Geological Survey is expanding National Assessment of Coastal Change Hazards and forecast products to coastal wetlands. The intent is to provide federal, state, and local managers with tools to estimate the vulnerability of coastal wetlands to various factors and to evaluate their ecosystem service potential. For this purpose, the response and resilience of coastal wetlands to physical factors need to be assessed in terms of the ensuing change to their vulnerability and ecosystem services. Edwin B. Forsythe National Wildlife Refuge (EBFNWR), New Jersey, was selected as a pilot study area. As part of this data synthesis effort, hydrodynamic and sediment transport...
Categories: Data;
Types: ArcGIS REST Map Service,
ArcGIS Service Definition,
Citation,
Downloadable,
Map Service;
Tags: Atlantic Ocean,
Barnegat Bay,
Edwin B. Forsythe National Wildlife Refuge,
Great Bay,
Little Egg Island,
GAP distribution models represent the areas where species are predicted to occur based on habitat associations. GAP distribution models are the spatial arrangement of environments suitable for occupation by a species. In other words, a species distribution is created using a deductive model to predict areas suitable for occupation within a species range. To represent these suitable environments, GAP compiled existing GAP data, where available, and compiled additional data where needed. Existing data sources were the Southwest Regional Gap Analysis Project (SWReGAP) and the Southeast Gap Analysis Project (SEGAP) as well as a data compiled by Sanborn Solutions and Mason, Bruce and Girard. Habitat associations were...
Categories: Data;
Types: ArcGIS REST Map Service,
Map Service;
Tags: Biodiversity,
Conservation,
GAP,
Gap Analysis,
Species Distribution,
Natural and anthropogenic contaminants, pathogens, and viruses are found in soils and sediments throughout the United States. Enhanced dispersion and concentration of these environmental health stressors in coastal regions can result from sea level rise and storm-derived disturbances. The combination of existing environmental health stressors and those mobilized by natural or anthropogenic disasters could adversely impact the health and resilience of coastal communities and ecosystems. This dataset displays the exposure potential to environmental health stressors in the Edwin B. Forsythe National Wildlife Refuge (EBFNWR), which spans over Great Bay, Little Egg Harbor, and Barnegat Bay in New Jersey, USA. Exposure...
Categories: Data;
Types: ArcGIS REST Map Service,
ArcGIS Service Definition,
Citation,
Downloadable,
Map Service;
Tags: Atlantic Ocean,
Barnegat Bay,
Edwin B. Forsythe National Wildlife Refuge,
Great Bay,
Little Egg Island,
Version 4.0 of this data release provides descriptions of more than 200 mineral districts, mines, and mineral occurrences (deposits, prospects, and showings) within the United States that are reported to contain substantial enrichments of the rare earth elements (REEs). These mineral occurrences include mined deposits, exploration prospects, and other occurrences with notable concentrations of the REEs. The inclusion of a particular mineral occurrence in this database is not meant to imply that it has economic potential. Rather, these occurrences were included to capture the distribution and characteristics of the known, reported REEs deposits in the United States, which are diverse in their geology and resource...
Categories: Data,
Data Release - Revised;
Types: ArcGIS REST Map Service,
ArcGIS Service Definition,
Downloadable,
Map Service;
Tags: Alaska,
Arizona,
Arkansas,
BLM,
Bureau of Land Management,
This data release provides descriptions of more than 60 mineral regions, mines, and mineral deposits within the United States and its territories that are reported to contain enrichments of cobalt (Co). To focus the scope of this data release, we report only mined deposits and exploration prospects with past production, or resource and reserve estimates of 1,000 metric tons or more of cobalt. Cobalt has diverse uses because of its properties, which include ferromagnetism, hardness, wear-resistance, low conductivity, and high melting point. The primary uses for cobalt are in rechargeable battery electrodes, and in superalloys used to make gas turbine engines. In 2017, the United States had a net import reliance...
Categories: Data;
Types: ArcGIS REST Map Service,
ArcGIS Service Definition,
Downloadable,
Map Service;
Tags: Alaska,
BLM,
Bureau of Land Management,
California,
GGGSC,
First, we would like to thank the wildland fire advisory group. Their wisdom and guidance helped us build the dataset as it currently exists. Currently, there are multiple, freely available wildland fire datasets that identify wildfire and prescribed fire areas across the United States. However, these datasets are all limited in some way. Time periods, spatial extents, attributes, and maintenance for these datasets are highly variable, and none of the existing datasets provide a comprehensive picture of wildfires that have burned since the 1800s. Utilizing a series of both manual processes and ArcGIS Python (arcpy) scripts, we merged 40 of these disparate datasets into a single dataset that encompasses the known...
Categories: Data;
Types: ArcGIS REST Map Service,
ArcGIS Service Definition,
Downloadable,
Map Service;
Tags: Fire,
North America,
Prescribed Burn,
Prescribed Fire,
Raster,
When a species is proposed for listing as endangered or threatened under the Endangered Species Act, the U.S. Fish and Wildlife Service must consider whether there are areas of habitat believed to be essential the species’ conservation. Those areas may be proposed for designation as “critical habitat.” Critical habitat is a term defined and used in the Act. It is a specific geographic area(s) that contains features essential for the conservation of a threatened or endangered species and that may require special management and protection. Critical habitat may include an area that is not currently occupied by the species but that will be needed for its recovery. An area is designated as “critical habitat” after the...
Categories: Data;
Types: ArcGIS REST Map Service,
ArcGIS Service Definition,
Citation,
Downloadable,
Map Service;
Tags: Alabama,
Alaska,
Arizona,
Arkansas,
Biota,
These data were created as part of the National Oceanic and Atmospheric Administration Coastal Services Center's efforts to create an online mapping viewer depicting potential sea level rise and its associated impacts on the nation's coastal areas. The purpose of the mapping viewer is to provide coastal managers and scientists with a preliminary look at sea level rise (slr) and coastal flooding impacts. The viewer is a screening-level tool that uses nationally consistent data sets and analyses.Data and maps provided can be used at several scales to help gauge trends and prioritize actions for different scenarios. The Sea Level Rise and Coastal Flooding Impacts Viewer may be accessed at: http://www.csc.noaa.gov/slr...
These data were created as part of the National Oceanic and Atmospheric Administration Coastal Services Center's efforts to create an online mapping viewer depicting potential sea level rise and its associated impacts on the nation's coastal areas. The purpose of the mapping viewer is to provide coastal managers and scientists with a preliminary look at sea level rise (slr) and coastal flooding impacts. The viewer is a screening-level tool that uses nationally consistent data sets and analyses.Data and maps provided can be used at several scales to help gauge trends and prioritize actions for different scenarios. The Sea Level Rise and Coastal Flooding Impacts Viewer may be accessed at: http://www.csc.noaa.gov/slr...
The recent proliferation of oil and natural gas energy development in the Greater Green River Basin of southwest Wyoming has accentuated the need to understand wildlife responses to this development. The location and extent of surface disturbance that is created by oil and natural gas well pad scars are key pieces of information used to assess the effects of energy infrastructure on wildlife populations and habitat. A digital database of oil and natural gas pad scars had previously been generated from 1-meter (m) National Agriculture Imagery Program imagery (NAIP) acquired in 2009 for a 7.7-million hectare (ha) (19,026,700 acres) region of southwest Wyoming (Garman and McBeth, 2014). Scars included the pad area...
Categories: Data;
Types: ArcGIS REST Map Service,
ArcGIS Service Definition,
Downloadable,
Map Service;
Tags: Albany County,
Carbon County,
Energy development,
Energy infrastructure,
Extraction,
This feature estimates the geographic extent of the sagebrush biome in the United States. It was created for the Western Association of Fish and Wildlife Agency’s (WAFWA) Sagebrush Conservation Strategy publication as a visual for the schematic figures. This layer does not represent the realized distribution of sagebrush and should not be used to summarize statistics about the distribution or precise location of sagebrush across the landscape. This layer is intended to generalize the sagebrush biome distribution using Landsat derived classified vegetation rasters (Rigge at al. 2019), Bureau of Land Management-designated Habitat Management Areas, state-designated Priority Areas for Conservation for sage-grouse, the...
Categories: Data;
Types: ArcGIS REST Map Service,
ArcGIS Service Definition,
Downloadable,
Map Service,
OGC WFS Layer,
OGC WMS Layer,
Shapefile;
Tags: Arizona,
Botany,
California,
Colorado,
Ecology,
|

|
