Filters: Tags: {"type":"Place"} (X) > Types: ArcGIS REST Map Service (X)
736 results (34ms)|
Filters
Date Range
Extensions
Types
Contacts
Categories
Tag Schemes
|
This map shows the location of herd management areas (HMAs).
Categories: Data,
Map;
Types: ArcGIS REST Map Service,
Map Service;
Tags: Colorado Plateau,
horse management areas
This map shows Class I Federal PSD Areas using features selected from the CBI Protected Areas Database. Non-attainment areas are not mapped.
Categories: Data,
Map;
Types: ArcGIS REST Map Service,
Map Service;
Tags: Class I PSD areas,
Colorado Plateau,
non-attainment areas
For the Green River Basin Landscape Conservation Design (GRB LCD) assessment, we mapped the vulnerability of the sagebrush ecosystem to oil and gas development for each 12-digit hydrologic unit. Using a vulnerability framework, we defined Sensitivity (S) as the multi-scale average of sagebrush ecosystem land cover derived from LANDFIRE Existing Vegetation Type (LANDFIRE 2014). Exposure (E) to oil and gas development was quantified as the average kernel density of active oil and gas wells at multiple scales. Potential Impact (PI) is the square root transformed product of oil and gas development exposure and sagebrush ecosystem sensitivity. Adaptive Capacity (AC) for sagebrush ecosystem was quantified as the inverse...
Categories: Data;
Types: ArcGIS REST Map Service,
ArcGIS Service Definition,
Downloadable,
Map Service;
Tags: Colorado,
Colorado,
EARTH SCIENCE > LAND SURFACE > LANDSCAPE,
Green River Basin,
Green River Basin,
This map shows the potential current distribution of Golden Eagle, in the context of current and near-term terrestrial intactness and long-term potential for climate change and energy development.
Categories: Data,
Map;
Types: ArcGIS REST Map Service,
Map Service;
Tags: Colorado Plateau,
Golden Eagle
For the Green River Basin Landscape Conservation Design (GRB LCD) assessment, we mapped the vulnerability of the critical habitat for threatened and endangered fish species to oil and gas development for each 12-digit hydrologic unit. The following threatened and endangered fish species were included in this vulnerability assessment: Colorado pikeminnow (Ptychocheilus lucius), Bonytail Chub (Gila elegans), Humpback chub (Gila cypha), and razorback sucker (Xyrauchen texanus). Using a vulnerability framework, we defined Sensitivity (S) as the average combined area of critical fish habitat within HUC12 polygons. Exposure (E) to oil and gas development was quantified the log transformed upstream flow accumulation of...
Categories: Data;
Types: ArcGIS REST Map Service,
ArcGIS Service Definition,
Downloadable,
Map Service;
Tags: Colorado,
Colorado,
EARTH SCIENCE > LAND SURFACE > LANDSCAPE,
Green River Basin,
Green River Basin,
For the Green River Basin Landscape Conservation Design (GRB LCD) assessment, we mapped the vulnerability of riparian habitat for terrestrial species and process. Using a vulnerability framework, we defined Sensitivity (S) as the percent riparian vegetation within the valley bottom and Exposure (E) as the amount of human modification within the valley bottom. For each 12-digit hydrologic unit code within the GRB LCD we summarized the riparian sensitivity and exposure to human modification. We also computed Potential Impact (PI), and Adaptive Capacity (AC) metrics at the HUC12 level. PI is the square root transformed product of human modification exposure and riparian sensitivity. AC for riparian exposure to human...
Categories: Data;
Types: ArcGIS REST Map Service,
ArcGIS Service Definition,
Downloadable,
Map Service,
OGC WFS Layer,
OGC WMS Layer,
Shapefile;
Tags: Colorado,
Colorado,
EARTH SCIENCE > LAND SURFACE > LANDSCAPE,
Green River Basin,
Green River Basin,
Wildfire and fuel treatment locations for the USFWS Pacific Southwest Region (California, Nevada, Klamath Basin OR) extracted from the Fire Management Information System (FMIS) on October 23, 2015, for fiscal years 1980-2015.
Categories: Data;
Types: ArcGIS REST Map Service,
ArcGIS Service Definition,
Citation,
Downloadable,
Map Service;
Tags: California,
Inventory and Monitoring,
Natural Resources,
Nevada,
Oregon,
The purpose of this dataset is to display the physical boundaries of Fire Management Zones within the U.S. Fish & Wildlife Service, Pacific Southwest Region.
Categories: Data;
Types: ArcGIS REST Map Service,
ArcGIS Service Definition,
Citation,
Downloadable,
Map Service;
Tags: California,
Nevada,
Oregon,
Wildlife Refuge,
boundaries,
Database for the Geologic Map of the Bonanza Caldera Area, Northeastern San Juan Mountains, Colorado
The San Juan Mountains in southwestern Colorado have long been recognized as a site of exceptionally voluminous mid-Tertiary volcanism, including at least 24 major ignimbrite sheets (each 150-5,000 km3) and associated caldera structures active at 33-23 Ma. More recent volcanologic and petrologic studies in the San Juan region have focused mainly on several ignimbrite-caldera systems: the southeastern area (Platoro complex), western calderas (Uncompahgre-Silverton-Lake City), the central cluster (La Garita-Creede calderas). The northeast San Juan region that was far less studied until recently occupies a transition between earlier volcanism in central Colorado and the larger-volume younger ignimbrite-caldera foci...
Categories: Data;
Types: ArcGIS REST Map Service,
ArcGIS Service Definition,
Downloadable,
Map Service;
Tags: Bonanza,
Colorado,
North America,
Saguache,
USGS Science Data Catalog (SDC),
This ArcGIS Map Package contains information on brook trout occupancy in the southern portion of the brook trout range (PA and south). Fish sample data from a number of state and federal agencies/organizations were used to define patches for brook trout as groups of occupied contiguous catchment polygons from the National Hydrography Dataset Plus Version 1 (NHDPlusV1) catchment GIS layer. After defining patches, NHDPlusV1 catchments were assigned occupancy codes. Then state and federal agencies reviewed patches and codes to verify data accuracy. A similar effort is currently being conducted by the Eastern Brook Trout Joint Venture to develop occupancy data for the remainder of the brook trout range including states...
Categories: Data;
Types: ArcGIS Map Package,
ArcGIS REST Map Service,
ArcGIS Service Definition,
Downloadable,
Map Service;
Tags: Biological Data,
Direct habitat alteration,
EBTJV,
FHP Product,
Georgia,
The State Geologic Map Compilation (SGMC) geodatabase of the conterminous United States (https://doi.org/10.5066/F7WH2N65) represents a seamless, spatial database of 48 State geologic maps that range from 1:50,000 to 1:1,000,000 scale. A national digital geologic map database is essential in interpreting other datasets that support numerous types of national-scale studies and assessments, such as those that provide geochemistry, remote sensing, or geophysical data. The SGMC is a compilation of the individual U.S. Geological Survey releases of the Preliminary Integrated Geologic Map Databases for the United States. The SGMC geodatabase also contains updated data for seven States and seven entirely new State geologic...
Categories: Data,
Data Release - Revised;
Types: ArcGIS REST Map Service,
ArcGIS Service Definition,
Downloadable,
Map Service;
Tags: Alabama,
Arizona,
Arkansas,
California,
Colorado,
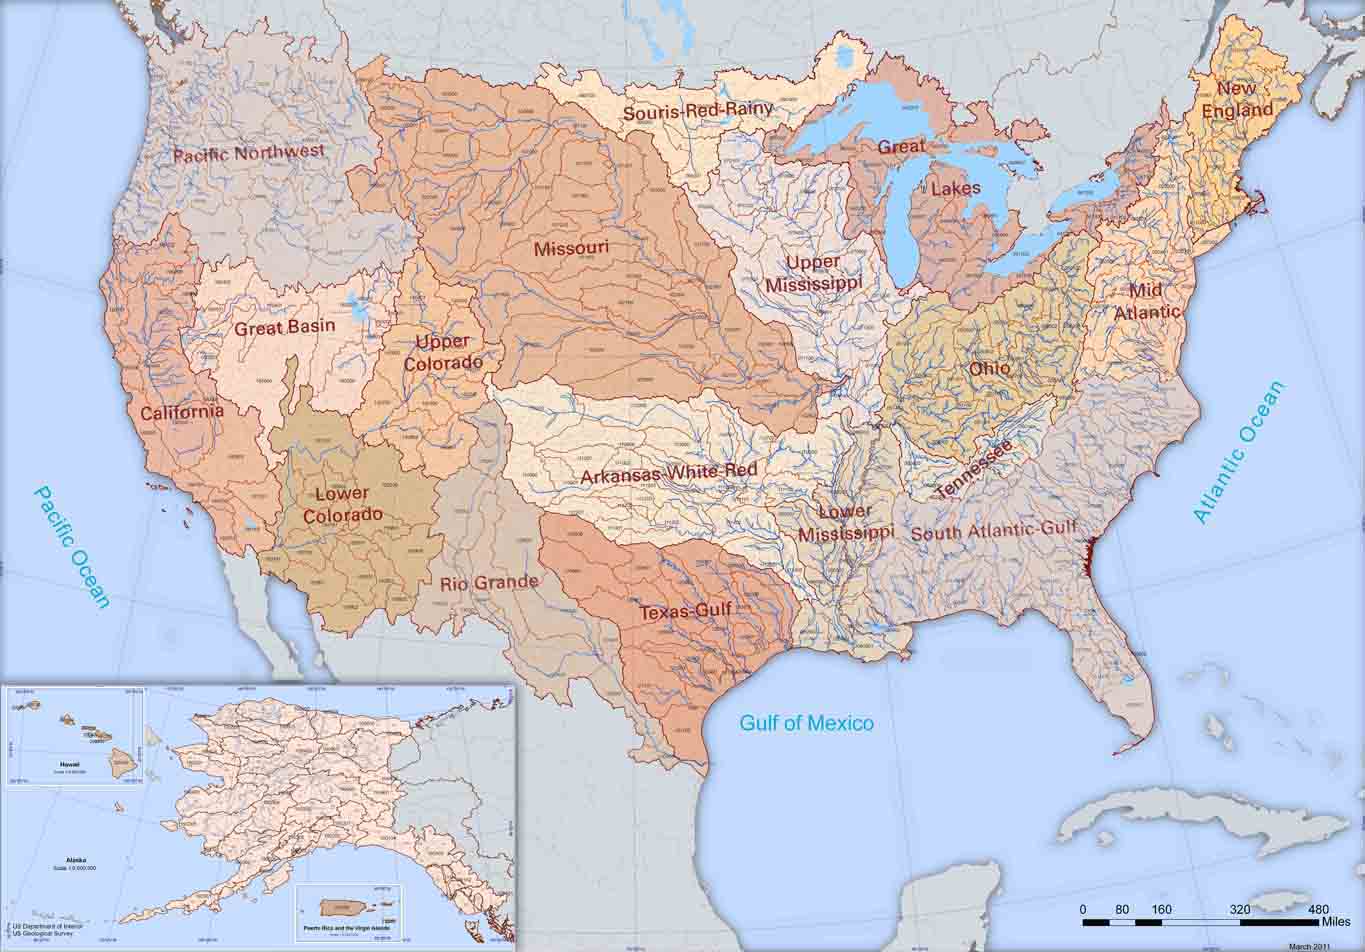
The Watershed Boundary Dataset (WBD) from The National Map (TNM) defines the perimeter of drainage areas formed by the terrain and other landscape characteristics. The drainage areas are nested within each other so that a large drainage area, such as the Upper Mississippi River, will be composed of multiple smaller drainage areas, such as the Wisconsin River. Each of these smaller areas can further be subdivided into smaller and smaller drainage areas. The WBD uses six different levels in this hierarchy, with the smallest averaging about 30,000 acres. The WBD is made up of polygons nested into six levels of data respectively defined by Regions, Subregions, Basins, Subbasins, Watersheds, and Subwatersheds. For additional...
As part of the Hurricane Sandy Science Plan, the U.S. Geological Survey is expanding National Assessment of Coastal Change Hazards and forecast products to coastal wetlands. The intent is to provide federal, state, and local managers with tools to estimate the vulnerability of coastal wetlands to various factors and to evaluate their ecosystem service potential. For this purpose, the response and resilience of coastal wetlands to physical factors need to be assessed in terms of the ensuing change to their vulnerability and ecosystem services. Edwin B. Forsythe National Wildlife Refuge (EBFNWR), New Jersey, was selected as a pilot study area. As part of this data synthesis effort, hydrodynamic and sediment transport...
Categories: Data;
Types: ArcGIS REST Map Service,
ArcGIS Service Definition,
Citation,
Downloadable,
Map Service;
Tags: Atlantic Ocean,
Barnegat Bay,
Edwin B. Forsythe National Wildlife Refuge,
Great Bay,
Little Egg Island,
This dataset contains field measurements of vegetation from the (1) Adirondack Sugar Maple Project (ASM), and (2) Buck Creek North and Buck Creek South Watersheds. The ASM data, collected in 2009 in 20 Adirondack watersheds (2 or 3 0.10 ha plots per watershed), are comprised of general plot characteristics, tree species identification and diameter at breast height (DBH) for all trees greater than 10 cm DBH, canopy position and health ratings, common and scientific names, and species identification and counts for saplings and seedlings. In Buck Creek North Tributary Watershed and Buck Creek South Tributary Watershed, near Inlet, New York, all trees greater than 5 cm DBH were identified in 15 circular plots (245 square...
Categories: Data;
Types: ArcGIS REST Map Service,
ArcGIS Service Definition,
Citation,
Downloadable,
Map Service;
Tags: Adirondack Mountains,
Forestry,
Soil Sciences,
USGS Science Data Catalog (SDC),
american beech,
Hurricane Sandy, which made landfall on October 29, 2012, near Brigantine, New Jersey, had a significant impact on coastal New Jersey, including the large areas of emergent wetlands at Edwin B. Forsythe National Wildlife Refuge (NWR) and the Barnegat Bay region. In response to Hurricane Sandy, U.S. Geological Survey (USGS) has undertaken several projects to assess the impacts of the storm and provide data and scientific analysis to support recovery and restoration efforts. As part of these efforts, the USGS Coastal and Marine Geology Program (CMGP) sponsored Coastal National Elevation Database (CoNED) Applications Project in collaboration with the USGS National Geospatial Program (NGP), and National Oceanic and...
Categories: Data;
Types: ArcGIS REST Map Service,
ArcGIS Service Definition,
Citation,
Downloadable,
Map Service;
Tags: Barnegat Bay,
Edwin B. Forsythe National Wildlife Refuge,
Elevation,
Environment,
LIDAR,
These layers show the relative abundance of native, non-native and tree cover types as mapped for the Colorado River Conservation Planning Project. Relative abundance (Dominant, Common, Mapped by Sparse and Not Mapped) is determined by the listing of cover types per patch.
This data set provides industrial-scale onshore wind turbine locations, corresponding facility information, and turbine technical specifications, in the United States to March 2014. The database has nearly 49,000 wind turbine records that have been collected, digitized, locationally verified, and internally quality assured and quality controlled. Turbines from the Federal Aviation Administration Digital Obstacle File, product date March 2, 2014, were used as the primary source of turbine data points. Verification of the position of turbines was done by visual interpretation using high-resolution aerial imagery in ESRI ArcGIS Desktop. Turbines without Federal Aviation Administration Obstacle Repository System (FAA...
Categories: Data;
Types: ArcGIS REST Map Service,
Citation,
Map Service;
Tags: Alabama,
Alaska,
Arizona,
Arkansas,
California,
Two models of fire risk are presented here. One shows risk of natural fire based on abundance of tamarisk and native trees only. The other shows risk of all fire, which includes abundance of tamarisk and native trees, but also proximity of human ignition sources (roads and campgrounds). Associated layers of the river channel at low flow and bottomland boundaries are included for reference.
Categories: Data;
Types: ArcGIS REST Map Service,
ArcGIS Service Definition,
Downloadable,
Map Service;
Tags: Canyonlands National Park,
Colorado River,
Grand County,
Risk of all fire,
San Juan County,
This dataset describes plume boundary extents for 2,4-dinitrotoluene (2,4-DNT) in the vicinity of the Badger Army Ammunition Plant in Sauk County, Wisconsin for various time intervals between 2000 - 2018.
Categories: Data;
Types: ArcGIS REST Map Service,
ArcGIS Service Definition,
Downloadable,
Map Service,
OGC WFS Layer,
OGC WMS Layer,
Shapefile;
Tags: Sauk,
Wisconsin,
groundwater,
groundwater quality,
water quality
This shapefile contains landscape factors representing human disturbances summarized to local and network catchments of river reaches for the Driftless Area Restoration Effort. This dataset is the result of clipping the feature class 'NFHAP 2010 HCI Scores and Human Disturbance Data for the Conterminous United States linked to NHDPLUSV1.gdb' to the boundary of the Driftless Area Restoration Effort. Landscape factors include land uses, population density, roads, dams, mines, and point-source pollution sites. The source datasets that were compiled and attributed to catchments were identified as being: (1) meaningful for assessing fish habitat; (2) consistent across the entire study area in the way that they were assembled;...
Categories: Data;
Types: ArcGIS REST Map Service,
Downloadable,
Map Service,
OGC WFS Layer,
OGC WMS Layer,
Shapefile;
Tags: Anthropogenic factors,
Aquatic habitats,
Atlantic Coast FHP,
Catchment areas,
Connecticut,
|

|
