Filters: Tags: Atlantic County (X)
43 results (16ms)|
Filters
Contacts
(Less)
|
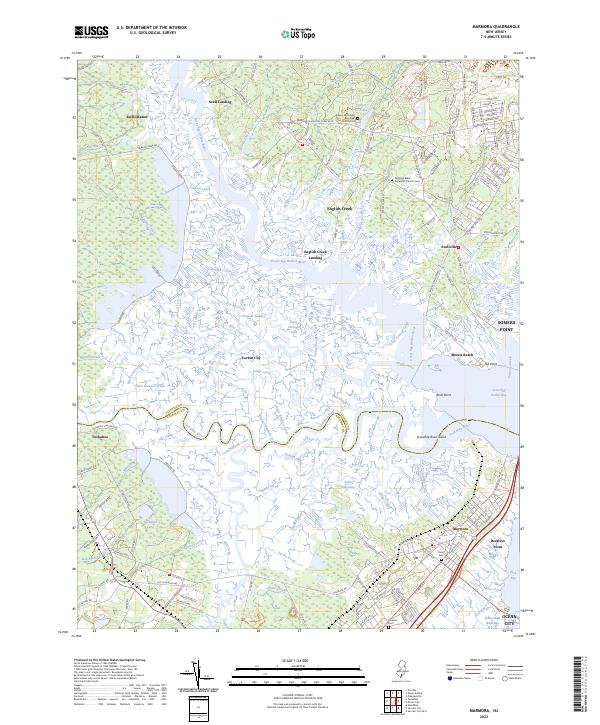
Layered geospatial PDF 7.5 Minute Quadrangle Map. Layers of geospatial data include orthoimagery, roads, grids, geographic names, elevation contours, hydrography, and other selected map features. This map is derived from GIS (geospatial information system) data. It represents a repackaging of GIS data in traditional map form, not creation of new information. The geospatial data in this map are from selected National Map data holdings and other government sources.
Layered geospatial PDF 7.5 Minute Quadrangle Map. Layers of geospatial data include orthoimagery, roads, grids, geographic names, elevation contours, hydrography, and other selected map features. This map is derived from GIS (geospatial information system) data. It represents a repackaging of GIS data in traditional map form, not creation of new information. The geospatial data in this map are from selected National Map data holdings and other government sources.
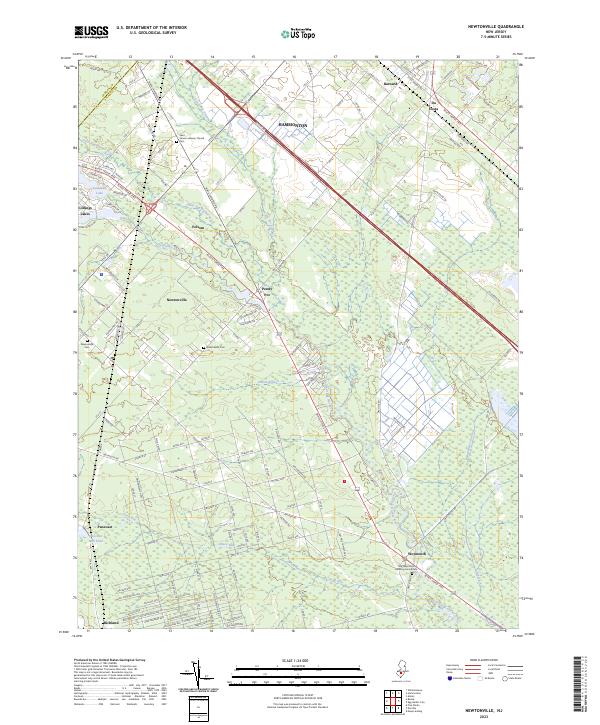
Layered geospatial PDF 7.5 Minute Quadrangle Map. Layers of geospatial data include orthoimagery, roads, grids, geographic names, elevation contours, hydrography, and other selected map features. This map is derived from GIS (geospatial information system) data. It represents a repackaging of GIS data in traditional map form, not creation of new information. The geospatial data in this map are from selected National Map data holdings and other government sources.
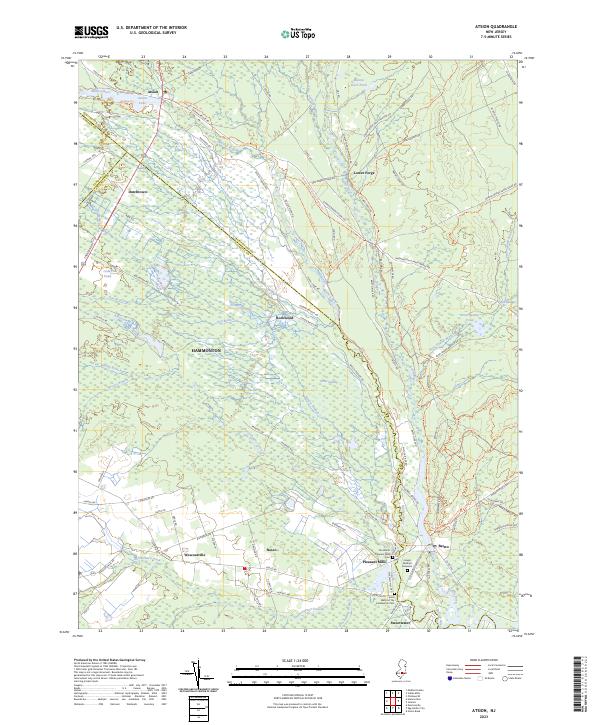
Layered geospatial PDF 7.5 Minute Quadrangle Map. Layers of geospatial data include orthoimagery, roads, grids, geographic names, elevation contours, hydrography, and other selected map features. This map is derived from GIS (geospatial information system) data. It represents a repackaging of GIS data in traditional map form, not creation of new information. The geospatial data in this map are from selected National Map data holdings and other government sources.
Layered geospatial PDF 7.5 Minute Quadrangle Map. Layers of geospatial data include orthoimagery, roads, grids, geographic names, elevation contours, hydrography, and other selected map features. This map is derived from GIS (geospatial information system) data. It represents a repackaging of GIS data in traditional map form, not creation of new information. The geospatial data in this map are from selected National Map data holdings and other government sources.
Layered geospatial PDF 7.5 Minute Quadrangle Map. Layers of geospatial data include orthoimagery, roads, grids, geographic names, elevation contours, hydrography, and other selected map features. This map is derived from GIS (geospatial information system) data. It represents a repackaging of GIS data in traditional map form, not creation of new information. The geospatial data in this map are from selected National Map data holdings and other government sources.
Layered geospatial PDF 7.5 Minute Quadrangle Map. Layers of geospatial data include orthoimagery, roads, grids, geographic names, elevation contours, hydrography, and other selected map features. This map is derived from GIS (geospatial information system) data. It represents a repackaging of GIS data in traditional map form, not creation of new information. The geospatial data in this map are from selected National Map data holdings and other government sources.
These are two land cover datasets derived from Landsat Thematic Mapper and Operational Land Imager (spatial resolution 30-m)Path 014 and Rows 032 and 033 surface reflectance data collected on July 14, 2011 and July 19, 2013, before and after Hurricane Sandy made landfall near Brigantine, New Jersey on October 29, 2012. The two land cover data sets provide a means of evaluating the effect of Hurricane Sandy of data sets collected at times that represent or approach peak vegetation growth. The most accurate results of the land cover classification are based on twelve classes, some of which occur adjacent to the marshes but not on the New Jersey intracoastal marshes. Twelve classes were used in the supervised maximum...
Categories: Data;
Types: Citation,
Downloadable,
GeoTIFF,
Map Service,
Raster;
Tags: Atlantic County,
Barnegat Bay,
Cape May County,
Coastal Zone,
Environmental restoration,
This USGS Data Release represents geospatial data sets that were created for the analysis of the effect of Hurricane Sandy on New Jersey Atlantic Coastal Marshes. The following listed image products were generated: 1) Fifteen marsh surface condition index (MSCI) data sets were calculated from yearly summer collections of ETM+ image data from 2000 to 2015. Three classes described the results of the MSCI mapping; classs1-severely impacted, class 2-moderately impacted, and class 3-intact marsh. 2) Marsh change data product using Landsat images of July 14, 2011 (before) and July 19, 2013 (after) Hurricane Sandy is based on the difference in the percentage of vegetation. It shows a pattern of an increasing loss of marsh...
Layered geospatial PDF 7.5 Minute Quadrangle Map. Layers of geospatial data include orthoimagery, roads, grids, geographic names, elevation contours, hydrography, and other selected map features. This map is derived from GIS (geospatial information system) data. It represents a repackaging of GIS data in traditional map form, not creation of new information. The geospatial data in this map are from selected National Map data holdings and other government sources.
Digital flood-inundation maps for an approximately 295-mile length of the New Jersey coastline and tidewaters through 10-coastal counties stretching from Cumberland County through Bergen County; including Cumberland, Cape May, Atlantic, Ocean, Monmouth, Middlesex, Union, Essex, Hudson, and Bergen counties were created by the U.S Geological Survey (USGS) in cooperation with the New Jersey Department of Environmental Protection (NJDEP) and New Jersey Office of Emergency Management (NJOEM). The flood-inundation maps depict extent and depth estimates of coastal flooding corresponding to selected tidal elevations recorded by 25 real-time USGS tide gages located throughout the length of the study area coastline. The flood-inundation...
Categories: Data;
Types: Map Service,
OGC WFS Layer,
OGC WMS Layer,
OGC WMS Service;
Tags: Atlantic County,
Bergen County,
Cape May County,
Cumberland County,
Essex County,
Layered geospatial PDF 7.5 Minute Quadrangle Map. Layers of geospatial data include orthoimagery, roads, grids, geographic names, elevation contours, hydrography, and other selected map features. This map is derived from GIS (geospatial information system) data. It represents a repackaging of GIS data in traditional map form, not creation of new information. The geospatial data in this map are from selected National Map data holdings and other government sources.
Layered geospatial PDF 7.5 Minute Quadrangle Map. Layers of geospatial data include orthoimagery, roads, grids, geographic names, elevation contours, hydrography, and other selected map features. This map is derived from GIS (geospatial information system) data. It represents a repackaging of GIS data in traditional map form, not creation of new information. The geospatial data in this map are from selected National Map data holdings and other government sources.
Layered geospatial PDF 7.5 Minute Quadrangle Map. Layers of geospatial data include orthoimagery, roads, grids, geographic names, elevation contours, hydrography, and other selected map features. This map is derived from GIS (geospatial information system) data. It represents a repackaging of GIS data in traditional map form, not creation of new information. The geospatial data in this map are from selected National Map data holdings and other government sources.
Layered geospatial PDF 7.5 Minute Quadrangle Map. Layers of geospatial data include orthoimagery, roads, grids, geographic names, elevation contours, hydrography, and other selected map features. This map is derived from GIS (geospatial information system) data. It represents a repackaging of GIS data in traditional map form, not creation of new information. The geospatial data in this map are from selected National Map data holdings and other government sources.
Layered geospatial PDF 7.5 Minute Quadrangle Map. Layers of geospatial data include orthoimagery, roads, grids, geographic names, elevation contours, hydrography, and other selected map features. This map is derived from GIS (geospatial information system) data. It represents a repackaging of GIS data in traditional map form, not creation of new information. The geospatial data in this map are from selected National Map data holdings and other government sources.
Layered geospatial PDF 7.5 Minute Quadrangle Map. Layers of geospatial data include orthoimagery, roads, grids, geographic names, elevation contours, hydrography, and other selected map features. This map is derived from GIS (geospatial information system) data. It represents a repackaging of GIS data in traditional map form, not creation of new information. The geospatial data in this map are from selected National Map data holdings and other government sources.
Layered geospatial PDF 7.5 Minute Quadrangle Map. Layers of geospatial data include orthoimagery, roads, grids, geographic names, elevation contours, hydrography, and other selected map features. This map is derived from GIS (geospatial information system) data. It represents a repackaging of GIS data in traditional map form, not creation of new information. The geospatial data in this map are from selected National Map data holdings and other government sources.
The change detection data is the classified difference in the percentage of vegetation on the July 14, 2011 Landsat Thematic Mapper(TM) data set collected before Hurricane Sandy and the July 19, 2013 Landsat Operational Land Imager (OLI)data set collected after Hurricane Sandy. Hurricane Sandy made landfall near Brigandine, New Jersey on October 29, 2012. The actual difference in the percentage of vegetation is used in the calculation, not the three-class classification that is the basis of the Marsh Surface Condition Index data. The eleven classes consist of five classes (5-20%,>20%-40%,>40%-60%,>60%-80%,>80%)with decreases in the percentage of vegetation cover after Hurricane Sandy, Three classes (5-20%,>20%-40%,>40%-60%)with...
Categories: Data;
Types: Citation,
Downloadable,
GeoTIFF,
Map Service,
Raster;
Tags: Atlantic County,
Barnegat Bay,
Cape May County,
Coastal Zone,
Environmental restoration,
Layered geospatial PDF 7.5 Minute Quadrangle Map. Layers of geospatial data include orthoimagery, roads, grids, geographic names, elevation contours, hydrography, and other selected map features. This map is derived from GIS (geospatial information system) data. It represents a repackaging of GIS data in traditional map form, not creation of new information. The geospatial data in this map are from selected National Map data holdings and other government sources.
|

|
