Filters: Tags: BULL ISLAND (X)
25 results (35ms)|
Filters
Date Range
Extensions Types Contacts
Categories Tag Types Tag Schemes |
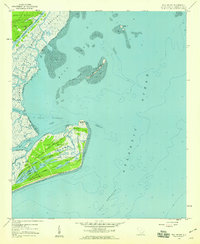
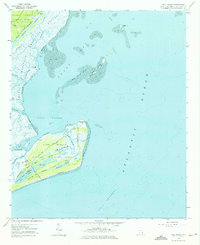
USGS Historical Quadrangle in GeoPDF.
The research was conducted at eight tidal marshes in coastal estuaries spanning the Washington and Oregon coastlines from Padilla Bay in northern Washington to Bandon located at the mouth of the Coquille River in southern Oregon. The researchers performed bathymetric surveys, created digital elevation models, measured historic rates of mineral and organic matter accumulation, conducted vegetation surveys, deployed water level data loggers, and produced WARMER wetland accretion model projections for each study site. This collection contains data for all of the above across a number of different datasets. Users should investigate the metadata for each item for more information about it's purpose, methods, quality,...
This data set contains imagery from the National Agriculture Imagery Program (NAIP). The NAIP program is administered by USDA FSA and has been established to support two main FSA strategic goals centered on agricultural production. These are, increase stewardship of America's natural resources while enhancing the environment, and to ensure commodities are procured and distributed effectively and efficiently to increase food security. The NAIP program supports these goals by acquiring and providing ortho imagery that has been collected during the agricultural growing season in the U.S. The NAIP ortho imagery is tailored to meet FSA requirements and is a fundamental tool used to support FSA farm and conservation programs....
The research was conducted at nine tidal marshes in coastal estuaries spanning the Washington and Oregon coastlines from Padilla Bay in northern Washington to Bandon located at the mouth of the Coquille River in southern Oregon. We performed bathymetric surveys using a shallow-water echo-sounding system comprised of an acoustic profiler, Leica Viva RTK GPS, and laptop computer mounted on a shallow-draft, portable flat-bottom boat. The RTK GPS enabled high resolution elevations of the water surface. The rover positions were received from the Leica Smartnet system (www.lecia-geosystems.com) or base station and referenced to the same bench mark used in the elevation surveys. We mounted a variable frequency transducer...
Categories: Data;
Types: ArcGIS REST Map Service,
ArcGIS Service Definition,
Downloadable,
Map Service;
Tags: Bandon,
Bandon marsh,
Bull Island,
Coos Bay,
Grays Harbor,
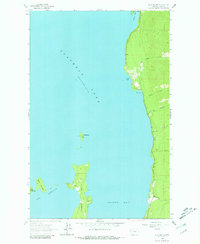
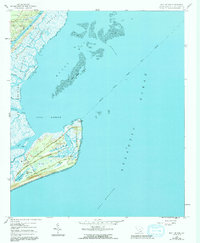
USGS Historical Quadrangle in GeoPDF.
Sandy ocean beaches in the United States are popular tourist and recreational destinations and constitute some of the most valuable real estate in the country. The boundary between land and water along the coastline is often the location of concentrated residential and commercial development and is frequently exposed to a range of natural hazards, which include flooding, storm effects, and coastal erosion. In response, the U.S. Geological Survey (USGS) is conducting a national assessment of coastal change hazards. One component of this research effort, the National Assessment of Shoreline Change Project (http://coastal.er.usgs.gov/shoreline-change/), documents changes in shoreline position as a proxy for coastal...
Categories: Data;
Types: Citation,
Downloadable,
Map Service,
OGC WFS Layer,
OGC WMS Layer,
Shapefile;
Tags: Atlantic Coast,
Bull Island,
CERC,
CERC map,
CMGP,
This data set contains imagery from the National Agriculture Imagery Program (NAIP). The NAIP program is administered by USDA FSA and has been established to support two main FSA strategic goals centered on agricultural production. These are, increase stewardship of America's natural resources while enhancing the environment, and to ensure commodities are procured and distributed effectively and efficiently to increase food security. The NAIP program supports these goals by acquiring and providing ortho imagery that has been collected during the agricultural growing season in the U.S. The NAIP ortho imagery is tailored to meet FSA requirements and is a fundamental tool used to support FSA farm and conservation programs....
Sandy ocean beaches in the United States are popular tourist and recreational destinations and constitute some of the most valuable real estate in the country. The boundary between land and water along the coastline is often the location of concentrated residential and commercial development and is frequently exposed to a range of natural hazards, which include flooding, storm effects, and coastal erosion. In response, the U.S. Geological Survey (USGS) is conducting a national assessment of coastal change hazards. One component of this research effort, the National Assessment of Shoreline Change Project (http://coastal.er.usgs.gov/shoreline-change/), documents changes in shoreline position as a proxy for coastal...
Categories: Data;
Types: Citation,
Downloadable,
Map Service,
OGC WFS Layer,
OGC WMS Layer,
Shapefile;
Tags: Accretion,
Atlantic Coast,
Bull Island,
CMGP,
Cape Romain,
This data set contains imagery from the National Agriculture Imagery Program (NAIP). The NAIP program is administered by USDA FSA and has been established to support two main FSA strategic goals centered on agricultural production. These are, increase stewardship of America's natural resources while enhancing the environment, and to ensure commodities are procured and distributed effectively and efficiently to increase food security. The NAIP program supports these goals by acquiring and providing ortho imagery that has been collected during the agricultural growing season in the U.S. The NAIP ortho imagery is tailored to meet FSA requirements and is a fundamental tool used to support FSA farm and conservation programs....
To assess the current topography of tidal marsh at the study sites we conducted survey-grade global positioning system (GPS) surveys between 2009 and 2014 using a Leica RX1200 Real Time Kinematic (RTK) rover (±1 cm horizontal, ±2 cm vertical accuracy; Leica Geosystems Inc., Norcross, GA; Figure 4). At sites with RTK GPS network coverage (Padilla, Port Susan, Nisqually, Siletz, Bull Island, and Bandon), rover positions were received in real time from the Leica Smartnet system via a CDMA modem (www.lecia-geosystems.com). At sites without network coverage (Skokomish, Grays Harbor, and Willapa), rover positions were received in real time from a Leica GS10 antenna base station via radio link. At sites where we used the...
Categories: Data;
Types: ArcGIS REST Map Service,
ArcGIS Service Definition,
Downloadable,
Map Service;
Tags: Bandon,
Bull Island,
Coos Bay,
Grays Harbor,
NWCASC,
USGS Historical Quadrangle in GeoPDF.
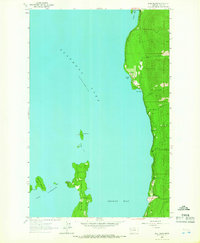
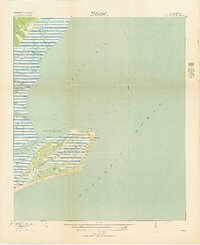
USGS Historical Quadrangle in GeoPDF.
Sandy ocean beaches in the United States are popular tourist and recreational destinations and constitute some of the most valuable real estate in the country. The boundary between land and water along the coastline is often the location of concentrated residential and commercial development and is frequently exposed to a range of natural hazards, which include flooding, storm effects, and coastal erosion. In response, the U.S. Geological Survey (USGS) is conducting a national assessment of coastal change hazards. One component of this research effort, the National Assessment of Shoreline Change Project (http://coastal.er.usgs.gov/shoreline-change/), documents changes in shoreline position as a proxy for coastal...
Categories: Data;
Types: Citation,
Downloadable,
Map Service,
OGC WFS Layer,
OGC WMS Layer,
Shapefile;
Tags: Atlantic Coast,
Baseline,
Bull Island,
CMGP,
Cape Romain,
Sandy ocean beaches in the United States are popular tourist and recreational destinations and constitute some of the most valuable real estate in the country. The boundary between land and water along the coastline is often the location of concentrated residential and commercial development and is frequently exposed to a range of natural hazards, which include flooding, storm effects, and coastal erosion. In response, the U.S. Geological Survey (USGS) is conducting a national assessment of coastal change hazards. One component of this research effort, the National Assessment of Shoreline Change Project (http://coastal.er.usgs.gov/shoreline-change/), documents changes in shoreline position as a proxy for coastal...
Categories: Data;
Types: Citation,
Downloadable,
Map Service,
OGC WFS Layer,
OGC WMS Layer,
Shapefile;
Tags: Accretion,
Atlantic Coast,
Bull Island,
CMGP,
Cape Romain,
USGS Historical Quadrangle in GeoPDF.
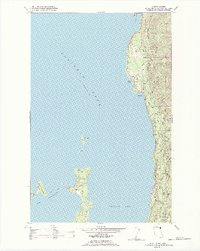
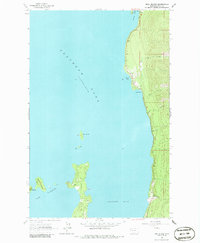
USGS Historical Quadrangle in GeoPDF.
USGS Historical Quadrangle in GeoPDF.
USGS Historical Quadrangle in GeoPDF.
This data set contains imagery from the National Agriculture Imagery Program (NAIP). The NAIP program is administered by USDA FSA and has been established to support two main FSA strategic goals centered on agricultural production. These are, increase stewardship of America's natural resources while enhancing the environment, and to ensure commodities are procured and distributed effectively and efficiently to increase food security. The NAIP program supports these goals by acquiring and providing ortho imagery that has been collected during the agricultural growing season in the U.S. The NAIP ortho imagery is tailored to meet FSA requirements and is a fundamental tool used to support FSA farm and conservation programs....
|

|
