Filters: Tags: Bear Creek (X)
61 results (55ms)|
Filters
Date Range
Extensions Types Contacts
Categories Tag Types
|
This location is part of the Arizona Mineral Industry Location System (AzMILS), an inventory of mineral occurences, prospects and mine locations in Arizona. Graham99 is located in T6S R27E Sec 5 SW in the Safford - 15 Min quad. This collection consists of various reports, maps, records and related materials acquired by the Arizona Department of Mines and Mineral Resources regarding mining properties in Arizona. Information was obtained by various means, including the property owners, exploration companies, consultants, verbal interviews, field visits, newspapers and publications. Some sections may be redacted for copyright. Please see the access statement.
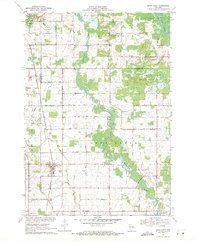
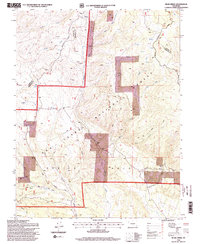
USGS Historical Quadrangle in GeoPDF.
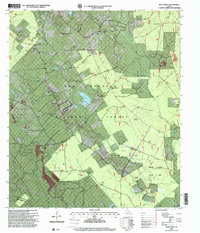
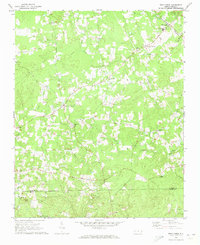
USGS Historical Quadrangle in GeoPDF.
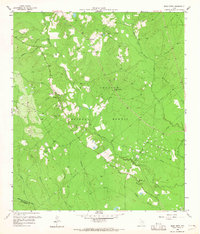
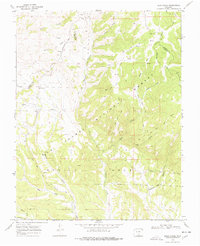
USGS Historical Quadrangle in GeoPDF.
This data release is a geochemical data set from the reanalysis of 23 rock and 85 sediment samples collected between 1966 and 1970 by the U.S. Geological Survey (USGS) for a series of studies investigating the mineral resources of the Idaho Primitive Area (Cater et al., 1973). The samples are from the upper Middle Fork Salmon River and the South Fork Salmon River, including the tributaries of East Fork of the South Fork and Porphyry Creek. The overall objective of this study is to characterize the regional impact of legacy mining for the Frank Church - River of No Return Wilderness Area. In 1980 the U. S. Congress passed the Central Idaho Wilderness Act which combined the Idaho Primitive Area, the Salmon Rivers...
Categories: Data;
Types: Downloadable,
Map Service,
OGC WFS Layer,
OGC WMS Layer,
Shapefile;
Tags: Automatic Creek,
Beansnapper Creek,
Bear Creek,
Big Chief Creek,
Big Cottonwood Creek,
Spreadsheet used to calculate Highway Site characteristics (Drainage area, slope and impervious fraction) for the Stochastic Empirical Loading Dilution Model (SELDM) . The spreadsheet was used in conjunction with the SELDM simulations used in the publication: Stonewall, A.J., and Granato, G.E., 2019, Assessing potential effects of highway and urban runoff on receiving streams in total maximum daily load watersheds in Oregon using the Stochastic Empirical Loading and Dilution Model: U.S. Geological Survey Scientific Investigations Report 2019-5053, 116 p., https://doi.org/10.3133/sir20195053.
Spreadsheet used to calculated hydrograph recession parameters (Minimum, Most Probable Value, and Maximum) for the Stochastic Empirical Loading Dilution Model (SELDM) . The spreadsheet was used in conjunction with the SELDM simulations used in the publication: Stonewall, A.J., and Granato, G.E., 2019, Assessing potential effects of highway and urban runoff on receiving streams in total maximum daily load watersheds in Oregon using the Stochastic Empirical Loading and Dilution Model: U.S. Geological Survey Scientific Investigations Report 2019-5053, 116 p., https://doi.org/10.3133/sir20195053
This data set contains imagery from the National Agriculture Imagery Program (NAIP). The NAIP program is administered by USDA FSA and has been established to support two main FSA strategic goals centered on agricultural production. These are increase stewardship of America's natural resources while enhancing the environment, and to ensure commodities are procured and distributed effectively and efficiently to increase food security. The NAIP program supports these goals by acquiring and providing ortho imagery that has been collected during the agricultural growing season in the U.S. The NAIP ortho imagery is tailored to meet FSA requirements and is a fundamental tool used to support FSA farm and conservation programs....
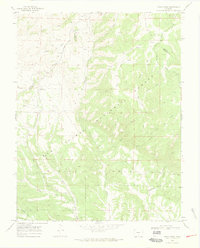
USGS Historical Quadrangle in GeoPDF.
USGS Historical Quadrangle in GeoPDF.
USGS Historical Quadrangle in GeoPDF.
This data set contains imagery from the National Agriculture Imagery Program (NAIP). The NAIP program is administered by USDA FSA and has been established to support two main FSA strategic goals centered on agricultural production. These are, increase stewardship of America's natural resources while enhancing the environment, and to ensure commodities are procured and distributed effectively and efficiently to increase food security. The NAIP program supports these goals by acquiring and providing ortho imagery that has been collected during the agricultural growing season in the U.S. The NAIP ortho imagery is tailored to meet FSA requirements and is a fundamental tool used to support FSA farm and conservation programs....
Side view of a bull dozer.
The State of Alaska Division of Geological & Geophysical Surveys (DGGS) produced a digital surface model (DSM) and an orthorectified aerial optical image mosaic (orthoimagery) of the Resurrection Bay watershed, surrounding the city of Seward in south-central Alaska. Aerial photographs and Global Navigation Satellite System (GNSS) data were collected on August 13, 2015, and were processed using Structure-from-Motion (SfM) photogrammetric techniques to create the DSM and orthoimagery. All data are projected in UTM Zone 6 North (meters) using the NAD83 (2011; EPSG 26906) horizontal datum and NAVD88 (Geoid12A; EPOCH 2010.00) vertical datum. The project was part of an ongoing investigation of the impact of flooding,...
This data set contains imagery from the National Agriculture Imagery Program (NAIP). The NAIP program is administered by USDA FSA and has been established to support two main FSA strategic goals centered on agricultural production. These are, increase stewardship of America's natural resources while enhancing the environment, and to ensure commodities are procured and distributed effectively and efficiently to increase food security. The NAIP program supports these goals by acquiring and providing ortho imagery that has been collected during the agricultural growing season in the U.S. The NAIP ortho imagery is tailored to meet FSA requirements and is a fundamental tool used to support FSA farm and conservation programs....
USGS Historical Quadrangle in GeoPDF.
ADMMR map collection: Kennecott Safford, Section 6750NW; 1 in. to 500 feet; 22 x 16 in.
The State of Alaska Division of Geological & Geophysical Surveys (DGGS) produced a digital surface model (DSM) and an orthorectified aerial optical image mosaic (orthoimagery) of the Resurrection Bay watershed, surrounding the city of Seward in south-central Alaska. Aerial photographs and Global Navigation Satellite System (GNSS) data were collected on August 13, 2015, and were processed using Structure-from-Motion (SfM) photogrammetric techniques to create the DSM and orthoimagery. All data are projected in UTM Zone 6 North (meters) using the NAD83 (2011; EPSG 26906) horizontal datum and NAVD88 (Geoid12A; EPOCH 2010.00) vertical datum. The project was part of an ongoing investigation of the impact of flooding,...
The gate at the Lone Star group with a Phelps Dodge sign on it.
This data set contains imagery from the National Agriculture Imagery Program (NAIP). The NAIP program is administered by USDA FSA and has been established to support two main FSA strategic goals centered on agricultural production. These are, increase stewardship of America's natural resources while enhancing the environment, and to ensure commodities are procured and distributed effectively and efficiently to increase food security. The NAIP program supports these goals by acquiring and providing ortho imagery that has been collected during the agricultural growing season in the U.S. The NAIP ortho imagery is tailored to meet FSA requirements and is a fundamental tool used to support FSA farm and conservation programs....
|

|
