Filters: Tags: Boulder County (X)
210 results (119ms)|
Filters
Date Range
Extensions Types Contacts
Categories Tag Types
|
BOULDER CREEK BLW 61ST STREET, NR BOULDER, CO
LEFT HAND CREEK NR NIWOT
LEFT HAND CREEK NR NIWOT
ROCK CREEK ABV ROCK CREEK PKWY, AT SUPERIOR, CO
ROCK CREEK ABV ROCK CREEK PKWY, AT SUPERIOR, CO
Layered geospatial PDF 7.5 Minute Quadrangle Map. Layers of geospatial data include orthoimagery, roads, grids, geographic names, elevation contours, hydrography, and other selected map features. This map is derived from GIS (geospatial information system) data. It represents a repackaging of GIS data in traditional map form, not creation of new information. The geospatial data in this map are from selected National Map data holdings and other government sources.
Layers of geospatial data include contours, boundaries, land cover, hydrography, roads, transportation, geographic names, structures, and other selected map features.
Layers of geospatial data include contours, boundaries, land cover, hydrography, roads, transportation, geographic names, structures, and other selected map features.
Layered geospatial PDF 7.5 Minute Quadrangle Map. Layers of geospatial data include orthoimagery, roads, grids, geographic names, elevation contours, hydrography, and other selected map features. This map is derived from GIS (geospatial information system) data. It represents a repackaging of GIS data in traditional map form, not creation of new information. The geospatial data in this map are from selected National Map data holdings and other government sources.
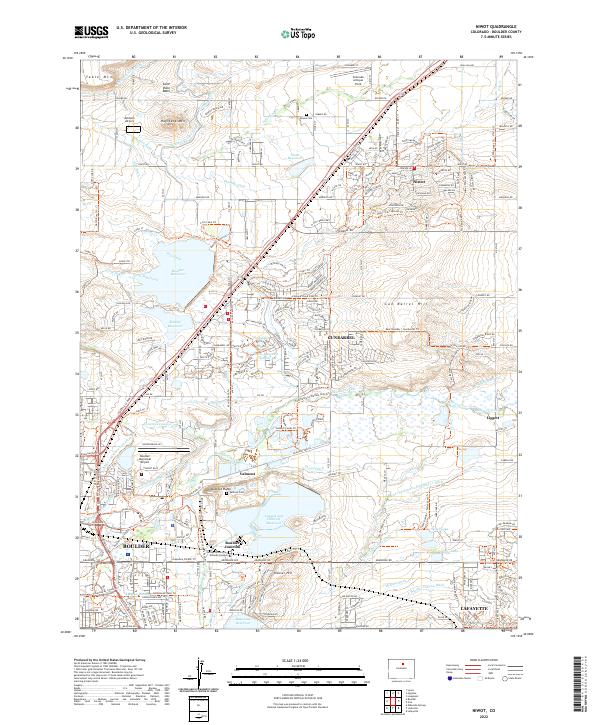
Layered geospatial PDF 7.5 Minute Quadrangle Map. Layers of geospatial data include orthoimagery, roads, grids, geographic names, elevation contours, hydrography, and other selected map features. This map is derived from GIS (geospatial information system) data. It represents a repackaging of GIS data in traditional map form, not creation of new information. The geospatial data in this map are from selected National Map data holdings and other government sources.
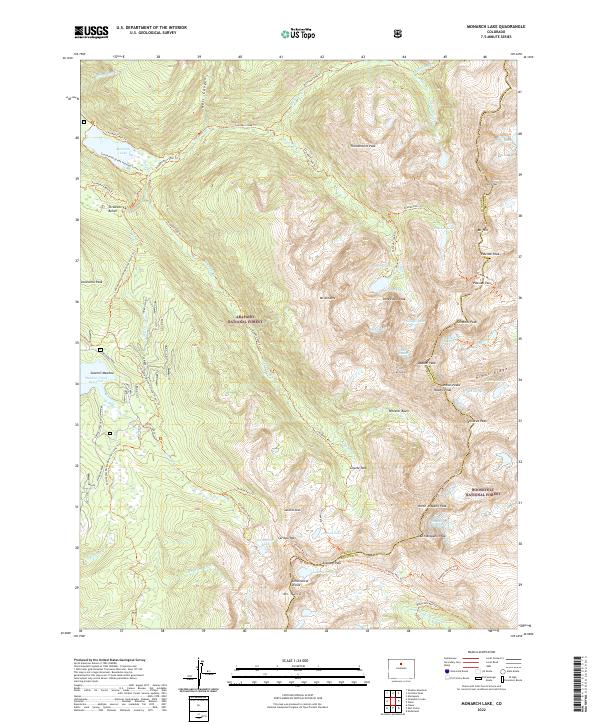
Layered geospatial PDF 7.5 Minute Quadrangle Map. Layers of geospatial data include orthoimagery, roads, grids, geographic names, elevation contours, hydrography, and other selected map features. This map is derived from GIS (geospatial information system) data. It represents a repackaging of GIS data in traditional map form, not creation of new information. The geospatial data in this map are from selected National Map data holdings and other government sources.
Classified probability of suitable habitat for Black Tailed Prairie Dogs for each cell of raster. Classification is based on 4 probability cutoff levels with category 1 being low habitat suitability and category 4 being high habitat suitability. Categorized probability data is created from fitting a global third-order model to county level raster data. For details on model fitting and data used to produce categorized probability raster see report. https://www.fws.gov/science/catalog
Categories: Data;
Types: Downloadable,
GeoTIFF,
Map Service,
Raster;
Tags: Black Tailed Prairie Dogs,
Boulder County,
Colorado,
Great Plains,
Habitat suitability,
This digital map shows the geographic extent of rock stratigraphic units (formations) as compiled by Colton in 1976 under the Front Range Urban Corridor Geology Program. Colton used his own geologic mapping and previously published geologic maps to compile one map having a single classification of geologic units. The resulting published color paper map (USGS Map I-855-G, Colton, 1978) was intended for land-use planning and to depict the regional geology. In 1997-1999, another USGS project designed to address urban growth issues was undertaken. This project, the USGS Front Range Infrastructure Resources Project, undertook to digitize Colton's map at 1:100,000 scale, making it useable in Geographical Information Systems...
LEFT HAND CREEK NR NIWOT
ROCK CREEK ABV ROCK CREEK PKWY, AT SUPERIOR, CO
N. Saint Vrain High JAMS Project Rocky Mountain National Park near Thunder Lake
N. Saint Vrain High JAMS Project Rocky Mountain National Park near Thunder Lake
S BOULDER CR AT BASELINE ROAD NR BOULDER COLO
LEFT HAND CREEK NR NIWOT
ROCK CREEK ABV ROCK CREEK PKWY, AT SUPERIOR, CO
|

|
