Filters: Tags: CAPE HENLOPEN (X)
30 results (53ms)|
Filters
Date Range
Extensions Types Contacts
Categories Tag Types Tag Schemes |
This data set contains imagery from the National Agriculture Imagery Program (NAIP). The NAIP program is administered by USDA FSA and has been established to support two main FSA strategic goals centered on agricultural production. These are, increase stewardship of America's natural resources while enhancing the environment, and to ensure commodities are procured and distributed effectively and efficiently to increase food security. The NAIP program supports these goals by acquiring and providing ortho imagery that has been collected during the agricultural growing season in the U.S. The NAIP ortho imagery is tailored to meet FSA requirements and is a fundamental tool used to support FSA farm and conservation programs....
Low altitude (300 meters above ground level (AGL)) digital aerial imagery were acquired on May 4 and 5, 2020, from a manned, fixed-wing aircraft using a Sony A7R 36 Megapixel digital camera, along with precise aircraft location Global Navigation Satellite System (GNSS) data. Data were collected in shore-parallel lines, flying at approximately 50 meters per second and capturing true color imagery at 1 Hertz, resulting in image footprints with approximately 75-80% endlap, 60-70% sidelap, and a ground sample distance (GSD) of 5.3 centimeters. The precise time of each image capture (flash event) was recorded, and the corresponding aircraft position was computed in post-processing from the aircraft navigation GNSS data;...
Low altitude (300 meters above ground level (AGL)) digital aerial imagery were acquired on June 11, 2022, from a manned, fixed-wing aircraft using a Sony A7R 36 Megapixel digital camera, along with precise aircraft location Global Navigation Satellite System (GNSS) data. Data were collected in shore-parallel lines, flying at approximately 50 meters per second and capturing true color imagery at 1 Hertz, resulting in image footprints with approximately 75–80% endlap, 60–70% sidelap, and a ground sample distance (GSD) of 5.3 centimeters. The precise time of each image capture (flash event) was recorded, and the corresponding aircraft position was computed in post-processing from the aircraft navigation GNSS data;...
Low altitude (300 meters above ground level (AGL)) digital aerial imagery acquired with a piloted fixed-wing aircraft was processed using Structure-from-Motion (SfM) photogrammetry techniques to produce high-resolution three-dimensional (3D) point clouds and digital elevation models (DEMs) and orthomosaic images. This dataset consists of DEMs produced from imagery collected along the Delaware Atlantic coast on June 11, 2022, to monitor coastal change. All horizontal data are provided in the Universal Transverse Mercator (UTM) projected coordinate system, Zone 18 North (18N), referenced to the North American Datum of 1983 (NAD83(2011)), and elevation is referenced to the North American Vertical Datum of 1988 (NAVD88),...
Low altitude (300 meters above ground level (AGL)) digital aerial imagery acquired with a piloted fixed-wing aircraft was processed using Structure-from-Motion (SfM) photogrammetry techniques to produce high-resolution three-dimensional (3D) point clouds and digital elevation models (DEMs) and orthomosaic images. This dataset consists of red-green-blue (RGB) orthomosaic images produced from imagery collected along the Delaware Atlantic coast on June 11, 2022, to monitor coastal change. All horizontal data are provided in the Universal Transverse Mercator (UTM) projected coordinate system, Zone 18 North (18N), referenced to the North American Datum of 1983 (NAD83(2011)).
These data are a qualitatively derived interpretive polygon shapefile defining surficial sediment type and distribution, and geomorphology, for nearly 1,400 square kilometers of sea floor on the inner-continental shelf from Fenwick Island, Maryland to Fisherman’s Island, Virginia, USA. These data are classified according to Barnhardt and others (1998) bottom-type classification system, which was modified to highlight changes in secondary sediment-types such as mud and gravel across this primarily sandy shelf. Most of the geophysical and sample data used to create this interpretive layer were collected as part of the Linking Coastal Processes and Vulnerability: Assateague Island Regional Study project (GS2-2C), supported...
Categories: Data;
Types: Downloadable,
Map Service,
OGC WFS Layer,
OGC WMS Layer,
Shapefile;
Tags: Assateague Island,
Assateague Island National Seashore,
Assawoman Island,
Atlantic Ocean,
Backscatter,
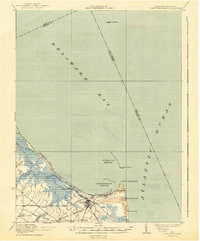
USGS Historical Quadrangle in GeoPDF.
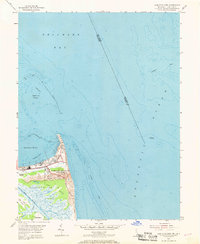
USGS Historical Quadrangle in GeoPDF.
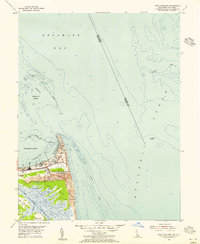
USGS Historical Quadrangle in GeoPDF.
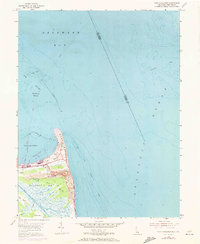
USGS Historical Quadrangle in GeoPDF.
Low altitude (300 meters above ground level (AGL)) digital aerial imagery were acquired on June 11, 2022, from a manned, fixed-wing aircraft using a Sony A7R 36 Megapixel digital camera, along with precise aircraft location Global Navigation Satellite System (GNSS) data. Data were collected in shore-parallel lines, flying at approximately 50 meters per second and capturing true color imagery at 1 Hertz, resulting in image footprints with approximately 75-80% endlap, 60-70% sidelap, and a ground sample distance (GSD) of 5.3 centimeters. The precise time of each image capture (flash event) was recorded, and the corresponding aircraft position was computed in post-processing from the aircraft navigation GNSS data;...
USGS Historical Quadrangle in GeoPDF.
USGS Historical Quadrangle in GeoPDF.
USGS Historical Quadrangle in GeoPDF.
USGS Historical Quadrangle in GeoPDF.
USGS Historical Quadrangle in GeoPDF.
Low altitude (300 meters above ground level (AGL)) digital aerial imagery were acquired on May 4 and 5, 2020, from a manned, fixed-wing aircraft using a Sony A7R 36 Megapixel digital camera, along with precise aircraft location Global Navigation Satellite System (GNSS) data. Data were collected in shore-parallel lines, flying at approximately 50 meters per second and capturing true color imagery at 1 Hertz, resulting in image footprints with approximately 75-80% endlap, 60-70% sidelap, and a ground sample distance (GSD) of 5.3 centimeters. The precise time of each image capture (flash event) was recorded, and the corresponding aircraft position was computed in post-processing from the aircraft navigation GNSS data;...
USGS Historical Quadrangle in GeoPDF.
Low altitude (300 meters above ground level (AGL)) digital aerial imagery acquired with a piloted fixed-wing aircraft was processed using Structure-from-Motion (SfM) photogrammetry techniques to produce high-resolution three-dimensional (3D) point clouds and digital elevation models (DEMs) and orthomosaic images. This dataset consists of DEMs produced from imagery collected along the Delaware Atlantic coast on May 4 and 5, 2020, to monitor coastal change. All horizontal data are provided in the Universal Transverse Mercator (UTM) projected coordinate system, Zone 18 North (18N), referenced to the North American Datum of 1983 (NAD83(2011)), and elevation is referenced to the North American Vertical Datum of 1988...
Low altitude (300 meters above ground level (AGL)) digital aerial imagery acquired with a piloted fixed-wing aircraft was processed using Structure-from-Motion (SfM) photogrammetry techniques to produce high-resolution three-dimensional (3D) point clouds and digital elevation models (DEMs) and orthomosaic images. This dataset consists of red-green-blue (RGB) orthomosaic images produced from imagery collected along the Delaware Atlantic coast on May 4 and 5, 2020, to monitor coastal change. All horizontal data are provided in the Universal Transverse Mercator (UTM) projected coordinate system, Zone 18 North (18N), referenced to the North American Datum of 1983 (NAD83(2011)).
|

|
