Filters: Tags: COOS BAY (X)
49 results (16ms)|
Filters
Date Range
Extensions Types Contacts
Categories Tag Types
|
This data set contains imagery from the National Agriculture Imagery Program (NAIP). The NAIP program is administered by USDA FSA and has been established to support two main FSA strategic goals centered on agricultural production. These are, increase stewardship of America's natural resources while enhancing the environment, and to ensure commodities are procured and distributed effectively and efficiently to increase food security. The NAIP program supports these goals by acquiring and providing ortho imagery that has been collected during the agricultural growing season in the U.S. The NAIP ortho imagery is tailored to meet FSA requirements and is a fundamental tool used to support FSA farm and conservation programs....
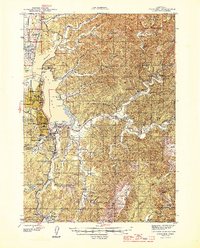
USGS Historical Quadrangle in GeoPDF.
USGS Historical Quadrangle in GeoPDF.
This data set contains imagery from the National Agriculture Imagery Program (NAIP). The NAIP program is administered by USDA FSA and has been established to support two main FSA strategic goals centered on agricultural production. These are, increase stewardship of America's natural resources while enhancing the environment, and to ensure commodities are procured and distributed effectively and efficiently to increase food security. The NAIP program supports these goals by acquiring and providing ortho imagery that has been collected during the agricultural growing season in the U.S. The NAIP ortho imagery is tailored to meet FSA requirements and is a fundamental tool used to support FSA farm and conservation programs....
To determine inundation patterns and calculate site-specific tidal datums, we deployed water level data loggers (Model 3001, Solinst Canada Ltd., Georgetown, Ontario, Canada and Model U-20-001-01-Ti, Onset Computer Corp., Bourne, MA, USA) at all sites over the study period. Each site had one or two loggers (n = 16). We placed loggers at the mouth and upper reaches of second-order tidal channels to capture high tides and determine seasonal inundation patterns. Water loggers collected water level readings every six minutes starting on the date of deployment and continuing to the present. We used data from the lowest elevation logger at each site to develop local hydrographs and inundation rates. We surveyed loggers...
The research was conducted at eight tidal marshes in coastal estuaries spanning the Washington and Oregon coastlines from Padilla Bay in northern Washington to Bandon located at the mouth of the Coquille River in southern Oregon. The researchers performed bathymetric surveys, created digital elevation models, measured historic rates of mineral and organic matter accumulation, conducted vegetation surveys, deployed water level data loggers, and produced WARMER wetland accretion model projections for each study site. This collection contains data for all of the above across a number of different datasets. Users should investigate the metadata for each item for more information about it's purpose, methods, quality,...
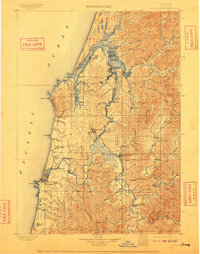
USGS Historical Quadrangle in GeoPDF.
USGS Historical Quadrangle in GeoPDF.
Harvest Units in the Coos Bay Sustained Yield Unit (SYU) portion of the Western Oregon Plan Revision (WOPR) area for the Proposed Resource Management Plan (PRMP).BLM (Bureau of Land Management) WOPR (Western Oregon Plan Revision) PRMP (Proposed Resource Management Plan) ASQ (Allowable Sale Quantity) SYU (Sustained Yield Unit) MOCA (Managed Owl Conservation Area) OMMS (Occupied Marbled Murrelet Sites) MAMU CHU (Marbled Murrelet Critical Habitat Unit) LSMA (Late Successional Management Area) This dataset is a PRMP release of the data wpr_cby_o_QCHarvUnits_poly.
OPTIONS model- post processing- of structural stages, stand age, and Northern Spotted Owl (NSO) habitat index at years 0, 10, 20, 30, 40, 50, 100 for the Coos Bay Sustained Yield Unit (SYU) portion of the Western Oregon Plan Revision (WOPR) area. *See Appendix R of the Western Oregon Plan Revision Proposed Resource Management Plan for further description.BLM (Bureau of Land Management) WOPR (Western Oregon Plan Revision) WOPR Theme Group: OPT (Options) WOPR Purpose: O (Options) GLUA: General Land Use Allocations PRMP: Proposed Resource Management Plan ASQ (Allowable Sale Quantity) SYU (Sustained Yield Unit) ESC (Existing Stand Condition) M4C WPR_ID (a unique identifier generated in the options harvest model preparation...
USDA-ARS researchers have put together high resolution ARC-GIS layers for intertidal bathymetry and distance to mouth as well as eelgrass, burrowing shrimp and oyster aquaculture habitats in Willapa Bay, Washington for this project. We await results of bathtub modeling exercise and climate scenario projections to integrate and validate models to examine effects of SLR and temperature and salinity changes on these habitats and engineering species. We have also assembled a historical layer representing native oyster (Ostrea lurida) habitat in Willapa Bay and are in the process of assembling data for oyster aquaculture and potential native oyster habitats in Coos Bay, Yaquina Bay, and Netarts estuaries in Oregon.
Categories: Publication;
Types: Citation,
ScienceBase Citation;
Tags: Washington,
Willapa Bay,
coos bay,
netarts bay,
oregon,
The research was conducted at nine tidal marshes in coastal estuaries spanning the Washington and Oregon coastlines from Padilla Bay in northern Washington to Bandon located at the mouth of the Coquille River in southern Oregon. We performed bathymetric surveys using a shallow-water echo-sounding system comprised of an acoustic profiler, Leica Viva RTK GPS, and laptop computer mounted on a shallow-draft, portable flat-bottom boat. The RTK GPS enabled high resolution elevations of the water surface. The rover positions were received from the Leica Smartnet system (www.lecia-geosystems.com) or base station and referenced to the same bench mark used in the elevation surveys. We mounted a variable frequency transducer...
Categories: Data;
Types: ArcGIS REST Map Service,
ArcGIS Service Definition,
Downloadable,
Map Service;
Tags: Bandon,
Bandon marsh,
Bull Island,
Coos Bay,
Grays Harbor,
This part of the Oregon OCS data release presents marine mammal observations from cruise 2014-607-FA in the Floating Wind Farm survey area. The survey was conducted using 12 hour day operations out of Charleston Harbor near Coos Bay, Oregon. The cruise plan consisted of 23 days on site split between sonar mapping and video ground truth surveying. Activities parsed out to nine days of sonar mapping, three days of video surveying, eight days of no operations due to weather, and three days mobilizing and demobilizing (table 1). Typically the Snavely would transit out to the survey area in an hour at a speed of 20 knots. Marine Mammal observations were made during the multibeam sonar mapping portion of the cruise only....
Categories: Data;
Types: Downloadable,
Map Service,
OGC WFS Layer,
OGC WMS Layer,
Shapefile;
Tags: CMGP,
Coastal and Marine Geology Program,
Coos Bay,
Mammals,
North Pacific Ocean,
This polygon shapefile is part of a data release of the Oregon outer continental shelf (OCS) proposed wind farm map site. The polygons have attribute values for Coastal and Marine Ecological Classification Standard (CMECS) geoforms, substrate, and modifiers. CMECS is the U.S. government standard for marine habitat characterization and was developed by representatives from a consortium of federal agencies. The standard provides an ecologically relevant structure for biologic, geologic, chemical, and physical habitat attributes. This map illustrates the geoform and substrate components of the standard. The CMECS classes are documented at https://www.fgdc.gov/standards/projects/FGDC-standards-projects/cmecs-folder/CMECS_Version_06-2012_FINAL.pdf....
Categories: Data;
Types: Citation,
Downloadable,
Map Service,
OGC WFS Layer,
OGC WMS Layer,
Shapefile;
Tags: BOEM,
Bureau of Ocean Energy Management,
CMECS,
CMGP,
Coastal and Marine Geology Program,
This data set contains imagery from the National Agriculture Imagery Program (NAIP). The NAIP program is administered by USDA FSA and has been established to support two main FSA strategic goals centered on agricultural production. These are, increase stewardship of America's natural resources while enhancing the environment, and to ensure commodities are procured and distributed effectively and efficiently to increase food security. The NAIP program supports these goals by acquiring and providing ortho imagery that has been collected during the agricultural growing season in the U.S. The NAIP ortho imagery is tailored to meet FSA requirements and is a fundamental tool used to support FSA farm and conservation programs....
To assess the current topography of tidal marsh at the study sites we conducted survey-grade global positioning system (GPS) surveys between 2009 and 2014 using a Leica RX1200 Real Time Kinematic (RTK) rover (±1 cm horizontal, ±2 cm vertical accuracy; Leica Geosystems Inc., Norcross, GA; Figure 4). At sites with RTK GPS network coverage (Padilla, Port Susan, Nisqually, Siletz, Bull Island, and Bandon), rover positions were received in real time from the Leica Smartnet system via a CDMA modem (www.lecia-geosystems.com). At sites without network coverage (Skokomish, Grays Harbor, and Willapa), rover positions were received in real time from a Leica GS10 antenna base station via radio link. At sites where we used the...
Categories: Data;
Types: ArcGIS REST Map Service,
ArcGIS Service Definition,
Downloadable,
Map Service;
Tags: Bandon,
Bull Island,
Coos Bay,
Grays Harbor,
NWCASC,
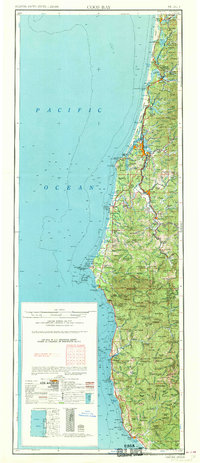
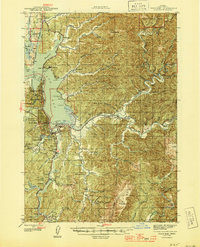
USGS Historical Quadrangle in GeoPDF.
This Data Release contains data from the U.S. Geological Survey (USGS) survey of the Oregon outer Continental shelf (OCS) Floating Wind Farm Site in 2014.The backscatter intensity data was collected along with bathymetry data by USGS during the period from August 20 to September 1, 2014, using a Reson 7111 multibeam echosounder. The mapping mission collected bathymetry data from about 163 m to 566 m depths on the Oregon outer continental shelf. The acquisition was funded by the U.S. Bureau of Ocean Energy Management.Within the final imagery, brighter tones indicate higher backscatter intensity, and darker tones indicate lower backscatter intensity. The intensity represents a complex interaction between the acoustic...
Categories: Data;
Types: Downloadable,
GeoTIFF,
Map Service,
Raster;
Tags: Backscatter,
Bathymetry,
CSMP,
Coos Bay,
Geology,
This data set contains imagery from the National Agriculture Imagery Program (NAIP). The NAIP program is administered by USDA FSA and has been established to support two main FSA strategic goals centered on agricultural production. These are, increase stewardship of America's natural resources while enhancing the environment, and to ensure commodities are procured and distributed effectively and efficiently to increase food security. The NAIP program supports these goals by acquiring and providing ortho imagery that has been collected during the agricultural growing season in the U.S. The NAIP ortho imagery is tailored to meet FSA requirements and is a fundamental tool used to support FSA farm and conservation programs....
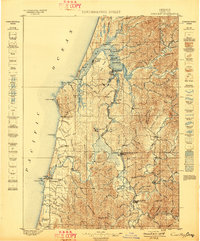
USGS Historical Quadrangle in GeoPDF.
|

|
