Filters: Tags: Cat Island (X)
24 results (66ms)|
Filters
Date Range
Extensions (Less) Types (Less) Contacts (Less)
Categories (Less) Tag Types Tag Schemes
|
This data set contains imagery from the National Agriculture Imagery Program (NAIP). The NAIP program is administered by USDA FSA and has been established to support two main FSA strategic goals centered on agricultural production. These are, increase stewardship of America's natural resources while enhancing the environment, and to ensure commodities are procured and distributed effectively and efficiently to increase food security. The NAIP program supports these goals by acquiring and providing ortho imagery that has been collected during the agricultural growing season in the U.S. The NAIP ortho imagery is tailored to meet FSA requirements and is a fundamental tool used to support FSA farm and conservation programs....
This data set contains imagery from the National Agriculture Imagery Program (NAIP). The NAIP program is administered by USDA FSA and has been established to support two main FSA strategic goals centered on agricultural production. These are, increase stewardship of America's natural resources while enhancing the environment, and to ensure commodities are procured and distributed effectively and efficiently to increase food security. The NAIP program supports these goals by acquiring and providing ortho imagery that has been collected during the agricultural growing season in the U.S. The NAIP ortho imagery is tailored to meet FSA requirements and is a fundamental tool used to support FSA farm and conservation programs....
This data set consists of digital data describing wetlands and uplands habitats for the Mississippi Coastal Improvements Program (MsCIP) area, consisting of Cat, Ship, Horn and Petit Bois Islands for the year 2020. Wetlands were classified using the Cowardin, et al., wetlands classification scheme to the level of freshwater and tidal, salinity modifiers. Uplands were classified using a customized classification scheme which can be cross-referenced to Anderson, et. al. For this dataset, upland dunes were delineated as areas at or above 1.524 meters (5 feet) as determined in the Lidar data that was referenced without modification for this classification. With this elevation criteria some delineated upland dune features...
Categories: Data;
Types: Downloadable,
Map Service,
OGC WFS Layer,
OGC WMS Layer,
Shapefile;
Tags: Cat Island,
Geography,
Habitats,
Horn Island,
Land Use Change,
The Mississippi Coastal Improvements Program (MsCIP) has developed a Comprehensive Barrier Island Restoration Plan containing options to ensure the integrity of the Mississippi barrier islands through restoration efforts. Any restoration activities implemented must have minimal adverse impacts to critical habitat for various marine, terrestrial and avian resources. Documenting the success of restoration activities in meeting this requirement requires habitat monitoring. In recent communications with MsCIP personnel, the MsCIP lacks a remotely sensed component to its habitat monitoring plan. Additionally, MsCIP personnel have expressed a need for data pertaining to critical habitat utilized by species of interest...
Categories: Data;
Types: Downloadable,
Map Service,
OGC WFS Layer,
OGC WMS Layer,
Shapefile;
Tags: Cat Island,
Climatology,
Ecology,
Geography,
Horn Island,
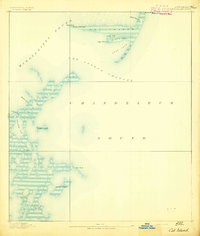
USGS Historical Quadrangle in GeoPDF.
The analyses of landscape change presented in this dataset use Landsat Thematic Mapper (TM), Enhanced Thematic Mapper (ETM) and Operational Land Imager (OLI) to assess changes in land area through time. All cloud-free dates of imagery from 1984 through early 2016 were used in this analysis. This amounted to a total of 174 dates of imagery which were analyzed. No water level restrictions were used during the image selection process as gages with a period of record sufficient for this analysis are not available nearby. Persistent loss and gain data are presented for 1984-2016.
Categories: Data;
Types: Citation;
Tags: Cat Island,
Horn Island,
Mississippi,
Petit Bois Island,
Ship Island,
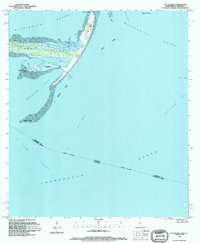
USGS Historical Quadrangle in GeoPDF.
Sandy ocean beaches in the United States are popular tourist and recreational destinations and constitute some of the most valuable real estate in the country. The boundary between land and water along the coastline is often the location of concentrated residential and commercial development and is frequently exposed to a range of natural hazards, which include flooding, storm effects, and coastal erosion. In response, the U.S. Geological Survey (USGS) is conducting a national assessment of coastal change hazards. One component of this research effort, the National Assessment of Shoreline Change Project, documents changes in shoreline position as a proxy for coastal change. Shoreline position is an easily understood...
Categories: Data;
Types: Citation,
Downloadable,
Map Service,
OGC WFS Layer,
OGC WMS Layer,
Shapefile;
Tags: CMGP,
Cat Island,
Coastal and Marine Geology Program,
DSAS,
Digital Shoreline Analysis System,
Sandy ocean beaches in the United States are popular tourist and recreational destinations and constitute some of the most valuable real estate in the country. The boundary between land and water along the coastline is often the location of concentrated residential and commercial development and is frequently exposed to a range of natural hazards, which include flooding, storm effects, and coastal erosion. In response, the U.S. Geological Survey (USGS) is conducting a national assessment of coastal change hazards. One component of this research effort, the National Assessment of Shoreline Change Project, documents changes in shoreline position as a proxy for coastal change. Shoreline position is an easily understood...
Types: Citation;
Tags: CMGP,
CSC,
Cat Island,
Coastal Services Center,
Coastal and Marine Geology Program,
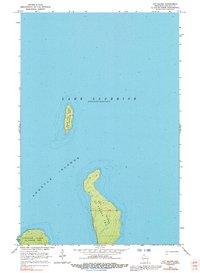
USGS Historical Quadrangle in GeoPDF.
This data set contains imagery from the National Agriculture Imagery Program (NAIP). The NAIP program is administered by USDA FSA and has been established to support two main FSA strategic goals centered on agricultural production. These are increase stewardship of America's natural resources while enhancing the environment, and to ensure commodities are procured and distributed effectively and efficiently to increase food security. The NAIP program supports these goals by acquiring and providing ortho imagery that has been collected during the agricultural growing season in the U.S. The NAIP ortho imagery is tailored to meet FSA requirements and is a fundamental tool used to support FSA farm and conservation programs....
Sandy ocean beaches in the United States are popular tourist and recreational destinations and constitute some of the most valuable real estate in the country. The boundary between land and water along the coastline is often the location of concentrated residential and commercial development and is frequently exposed to a range of natural hazards, which include flooding, storm effects, and coastal erosion. In response, the U.S. Geological Survey (USGS) is conducting a national assessment of coastal change hazards. One component of this research effort, the National Assessment of Shoreline Change Project, documents changes in shoreline position as a proxy for coastal change. Shoreline position is an easily understood...
Categories: Data;
Types: Citation,
Downloadable,
Map Service,
OGC WFS Layer,
OGC WMS Layer,
Shapefile;
Tags: Accretion,
CMGP,
Cat Island,
Coastal and Marine Geology Program,
DSAS,
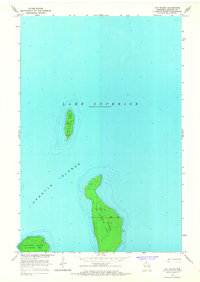
USGS Historical Quadrangle in GeoPDF.
USGS Historical Quadrangle in GeoPDF.
USGS Historical Quadrangle in GeoPDF.
To document current Mississippi barrier island conditions, imagery was acquired February 28, 2020 using Airborne GPs and field control ground markers. For ground control, markers were established and surveyed in using Real Time Kinematic (RTK) survey equipment. The imagery collected will be processed to produce a mosaic of all 4 islands (Cat, East and West Ship, Horn and Petit Bois) and interpreted to classify wetland marshes. The classified data will not only quantify how much marsh is being affected, but the data will also provide a spatial aspect as to where these degrading marsh fragmentations are occurring. The data will be correlated with other data such as salinity, prescribed burns, flooding frequency and...
USGS Historical Quadrangle in GeoPDF.
Sandy ocean beaches in the United States are popular tourist and recreational destinations and constitute some of the most valuable real estate in the country. The boundary between land and water along the coastline is often the location of concentrated residential and commercial development and is frequently exposed to a range of natural hazards, which include flooding, storm effects, and coastal erosion. In response, the U.S. Geological Survey (USGS) is conducting a national assessment of coastal change hazards. One component of this research effort, the National Assessment of Shoreline Change Project, documents changes in shoreline position as a proxy for coastal change. Shoreline position is an easily understood...
Categories: Data;
Types: Citation,
Downloadable,
Map Service,
OGC WFS Layer,
OGC WMS Layer,
Shapefile;
Tags: Accretion,
CMGP,
Cat Island,
Coastal and Marine Geology Program,
DSAS,
Sandy ocean beaches in the United States are popular tourist and recreational destinations and constitute some of the most valuable real estate in the country. The boundary between land and water along the coastline is often the location of concentrated residential and commercial development and is frequently exposed to a range of natural hazards, which include flooding, storm effects, and coastal erosion. In response, the U.S. Geological Survey (USGS) is conducting a national assessment of coastal change hazards. One component of this research effort, the National Assessment of Shoreline Change Project, documents changes in shoreline position as a proxy for coastal change. Shoreline position is an easily understood...
Categories: Data;
Types: Citation,
Downloadable,
Map Service,
OGC WFS Layer,
OGC WMS Layer,
Shapefile;
Tags: Baseline,
CMGP,
Cat Island,
Coastal and Marine Geology Program,
DSAS,
|

|
