Filters: Tags: Cattaraugus County (X)
102 results (115ms)|
Filters
Date Range
Types Contacts
Categories Tag Types
|
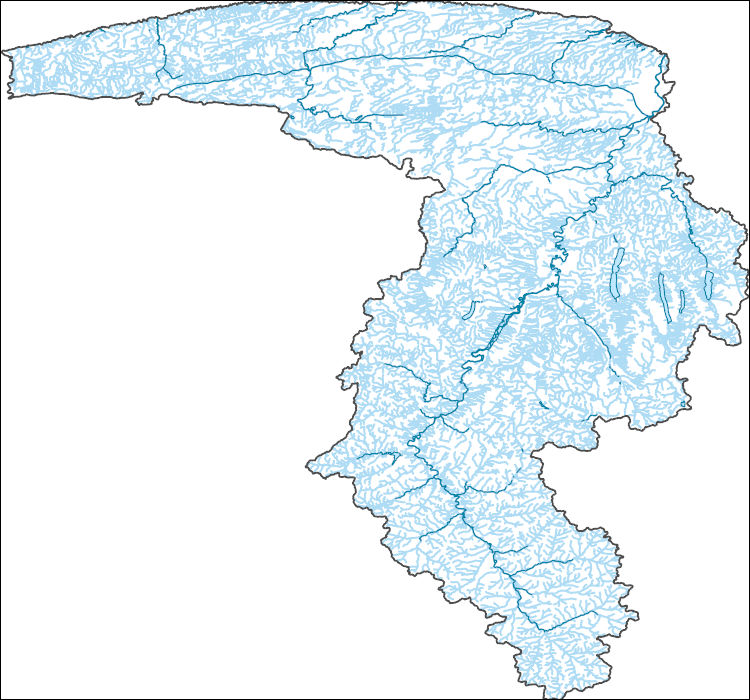
The High Resolution National Hydrography Dataset Plus (NHDPlus HR) is an integrated set of geospatial data layers, including the best available National Hydrography Dataset (NHD), the 10-meter 3D Elevation Program Digital Elevation Model (3DEP DEM), and the National Watershed Boundary Dataset (WBD). The NHDPlus HR combines the NHD, 3DEP DEMs, and WBD to create a stream network with linear referencing, feature naming, "value added attributes" (VAAs), elevation-derived catchments, and other features for hydrologic data analysis. The stream network with linear referencing is a system of data relationships applied to hydrographic systems so that one stream reach "flows" into another and "events" can be tied to and traced...
This dataset includes well logs used in the creation of the Olean hydrogeologic framework. Well logs were used from multiple sources (DEC, DOT, NWIS, ESOGIS, and recently digitized archived material) and were a crucial component in generating hydrogeologic layer elevations and thicknesses. Well logs are available in their original form on GeoLog Locator (https://webapps.usgs.gov/GeoLogLocator/#!/) and provided here in the digitized form (shapefiles and feature classes), which were used in the generation of the hydrogeologic framework.
This dataset includes "smoothing points" used in the creation of the Jamestown hydrogeologic framework. Smoothing points were manually added and were used to enhance interpolated layers using geologic assumptions and include: valley edge points, centerline bedrock points, and upland bedrock SSURGO points.
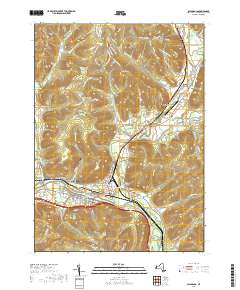
Layered geospatial PDF 7.5 Minute Quadrangle Map. Layers of geospatial data include orthoimagery, roads, grids, geographic names, elevation contours, hydrography, and other selected map features. This map is derived from GIS (geospatial information system) data. It represents a repackaging of GIS data in traditional map form, not creation of new information. The geospatial data in this map are from selected National Map data holdings and other government sources.
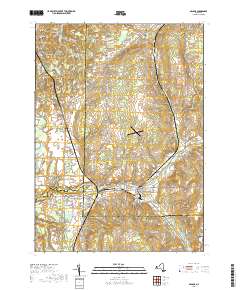
Layered geospatial PDF 7.5 Minute Quadrangle Map. Layers of geospatial data include orthoimagery, roads, grids, geographic names, elevation contours, hydrography, and other selected map features. This map is derived from GIS (geospatial information system) data. It represents a repackaging of GIS data in traditional map form, not creation of new information. The geospatial data in this map are from selected National Map data holdings and other government sources.
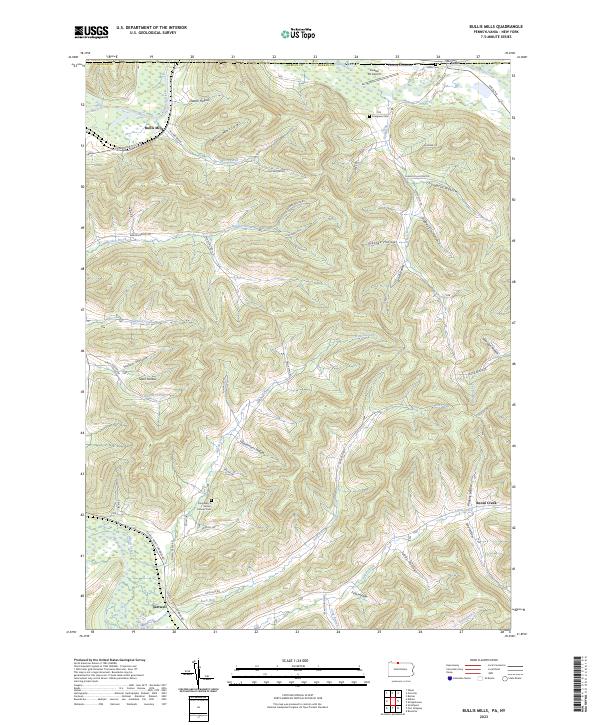
Layered geospatial PDF 7.5 Minute Quadrangle Map. Layers of geospatial data include orthoimagery, roads, grids, geographic names, elevation contours, hydrography, and other selected map features. This map is derived from GIS (geospatial information system) data. It represents a repackaging of GIS data in traditional map form, not creation of new information. The geospatial data in this map are from selected National Map data holdings and other government sources.
This dataset includes spreadsheets with statistical data (mean and median absolute error) used in deciding which interpolation method best fit the corresponding dataset. All statistical data were paired with a visual inspection of the interpolation prior to determining the final raster product. All spreadsheets were generated using an automated python script (Jahn, 2020).
This dataset includes georeferenced TIFF files from two separate reports for the Jamestown study area that have been digitized into feature classes within ArcGIS. Not all digitized and georeferenced data was necessarily used in the final interpolations, however they may have contributed to understanding the local hydrogeology.
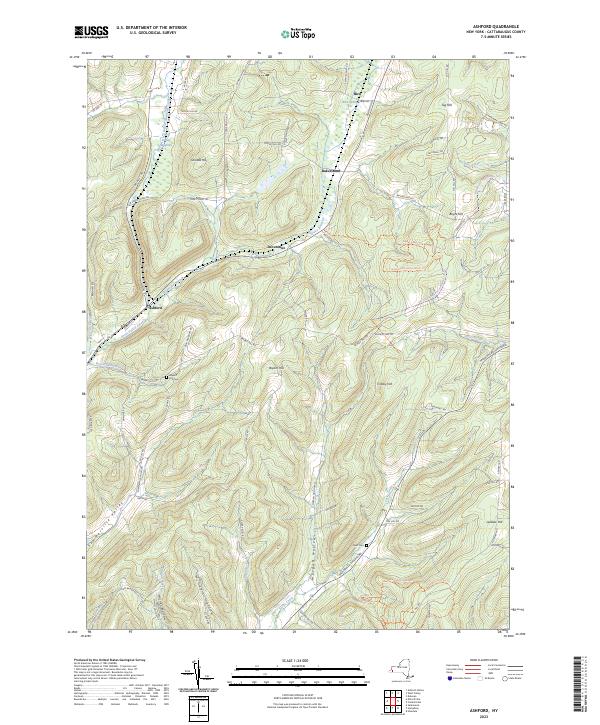
Layered geospatial PDF 7.5 Minute Quadrangle Map. Layers of geospatial data include orthoimagery, roads, grids, geographic names, elevation contours, hydrography, and other selected map features. This map is derived from GIS (geospatial information system) data. It represents a repackaging of GIS data in traditional map form, not creation of new information. The geospatial data in this map are from selected National Map data holdings and other government sources.
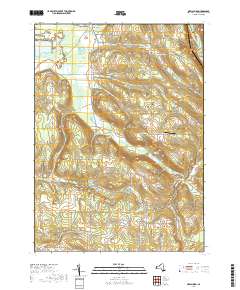
Layered geospatial PDF 7.5 Minute Quadrangle Map. Layers of geospatial data include orthoimagery, roads, grids, geographic names, elevation contours, hydrography, and other selected map features. This map is derived from GIS (geospatial information system) data. It represents a repackaging of GIS data in traditional map form, not creation of new information. The geospatial data in this map are from selected National Map data holdings and other government sources.
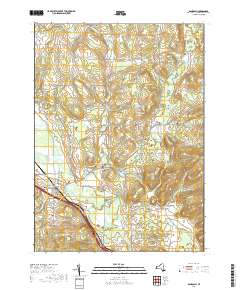
Layered geospatial PDF 7.5 Minute Quadrangle Map. Layers of geospatial data include orthoimagery, roads, grids, geographic names, elevation contours, hydrography, and other selected map features. This map is derived from GIS (geospatial information system) data. It represents a repackaging of GIS data in traditional map form, not creation of new information. The geospatial data in this map are from selected National Map data holdings and other government sources.
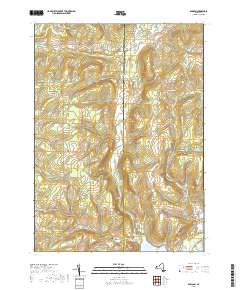
Layered geospatial PDF 7.5 Minute Quadrangle Map. Layers of geospatial data include orthoimagery, roads, grids, geographic names, elevation contours, hydrography, and other selected map features. This map is derived from GIS (geospatial information system) data. It represents a repackaging of GIS data in traditional map form, not creation of new information. The geospatial data in this map are from selected National Map data holdings and other government sources.
Layered geospatial PDF 7.5 Minute Quadrangle Map. Layers of geospatial data include orthoimagery, roads, grids, geographic names, elevation contours, hydrography, and other selected map features. This map is derived from GIS (geospatial information system) data. It represents a repackaging of GIS data in traditional map form, not creation of new information. The geospatial data in this map are from selected National Map data holdings and other government sources.
Layered geospatial PDF 7.5 Minute Quadrangle Map. Layers of geospatial data include orthoimagery, roads, grids, geographic names, elevation contours, hydrography, and other selected map features. This map is derived from GIS (geospatial information system) data. It represents a repackaging of GIS data in traditional map form, not creation of new information. The geospatial data in this map are from selected National Map data holdings and other government sources.
Layered geospatial PDF 7.5 Minute Quadrangle Map. Layers of geospatial data include orthoimagery, roads, grids, geographic names, elevation contours, hydrography, and other selected map features. This map is derived from GIS (geospatial information system) data. It represents a repackaging of GIS data in traditional map form, not creation of new information. The geospatial data in this map are from selected National Map data holdings and other government sources.
Layered geospatial PDF 7.5 Minute Quadrangle Map. Layers of geospatial data include orthoimagery, roads, grids, geographic names, elevation contours, hydrography, and other selected map features. This map is derived from GIS (geospatial information system) data. It represents a repackaging of GIS data in traditional map form, not creation of new information. The geospatial data in this map are from selected National Map data holdings and other government sources.
Layered geospatial PDF 7.5 Minute Quadrangle Map. Layers of geospatial data include orthoimagery, roads, grids, geographic names, elevation contours, hydrography, and other selected map features. This map is derived from GIS (geospatial information system) data. It represents a repackaging of GIS data in traditional map form, not creation of new information. The geospatial data in this map are from selected National Map data holdings and other government sources.
Digital hydrogeologic datasets were developed for the Jamestown study area in upstate New York in cooperation with the New York State Department of Environmental Conservation. These datasets define the hydrogeologic framework of the valley-fill aquifer and surrounding till-covered uplands within the study area. Datasets include: bedrock elevation raster, lacustrine silt and clay top and bottom elevation rasters (where present), LIDAR minimum elevation raster, lacustrine extent polygon, valley-fill extent polygon, and surficial geology polygons. Elevation layers were interpolated at 125-foot discretization to match what was done in previous work.
From July through December 2016, 56 environmental samples were collected from the Mohawk and Western New York River Basins. Samples were collected from nine production wells and 13 domestic wells in the Mohawk River Basin, and 17 production wells and 17 domestic wells in the Western New York River Basins. Samples were collected and processed using standard USGS methods and analyzed for 320 constituents including physicochemical properties, dissolved gases, major ions, nutrients, trace elements, pesticides, volatile organic compounds, radionuclides, and indicator bacteria. Analytical methods are described and referenced in Gaige and others (2023). Five of the Mohawk River Basin wells (HE 622, HE 624, OE1468, SA1501,...
Categories: Data;
Types: Map Service,
OGC WFS Layer,
OGC WMS Layer,
OGC WMS Service;
Tags: Albany County,
Allegany County,
Ambient Monitoring,
Cattaraugus County,
Chautauqua County,
Layered geospatial PDF 7.5 Minute Quadrangle Map. Layers of geospatial data include orthoimagery, roads, grids, geographic names, elevation contours, hydrography, and other selected map features. This map is derived from GIS (geospatial information system) data. It represents a repackaging of GIS data in traditional map form, not creation of new information. The geospatial data in this map are from selected National Map data holdings and other government sources.
|

|
