Filters: Tags: Cayuga county (X)
76 results (102ms)|
Filters
Contacts
(Less)
|
From April through September of 2018, water-quality data were collected at 35 locations from select tributaries, embayments, and nearshore lake locations along New York's portion of Lake Ontario in support of the 2018 Cooperative Science and Monitoring Initiative, the Great Lakes Restoration Initiative, and the Lakewide Action Management Plan. These data include environmental, replicate, and blank samples of nutrients, suspended solids, sodium, and chloride, as well as field measurements of physical parameters (temperature, specific conductance, dissolved oxygen, pH, turbidity, phycocyanin relative fluorescence, chlorophyll relative fluorescence, photosynthetically active radiation, and phycocyanin:cholorphyll...
Categories: Data;
Types: Downloadable,
Map Service,
OGC WFS Layer,
OGC WMS Layer,
Shapefile;
Tags: Cayuga County,
Hydrology,
Jefferson County,
Lake Ontario,
Monroe County,
This child item dataset contains a shapefile of labels for hydrogeologic sections illustrated in Heisig, 2023 (figure 3, plate 1). The "Sec_ID" attribute lists letter-number designations for the ends of each section. Hydrogeologic section labels are in the format x - x'. By convention, the x is on the west side and the x' is on the east side of generally horizontal sections. In generally vertical sections, the x is the westernmost of the section ends and the x' is the eastermost end of the section line.
Categories: Data;
Types: Downloadable,
Map Service,
OGC WFS Layer,
OGC WMS Layer,
Shapefile;
Tags: Aquifer Mapping,
Basin & Hydrogeologic Characterization,
Cayuga County,
Freeville,
Groton,
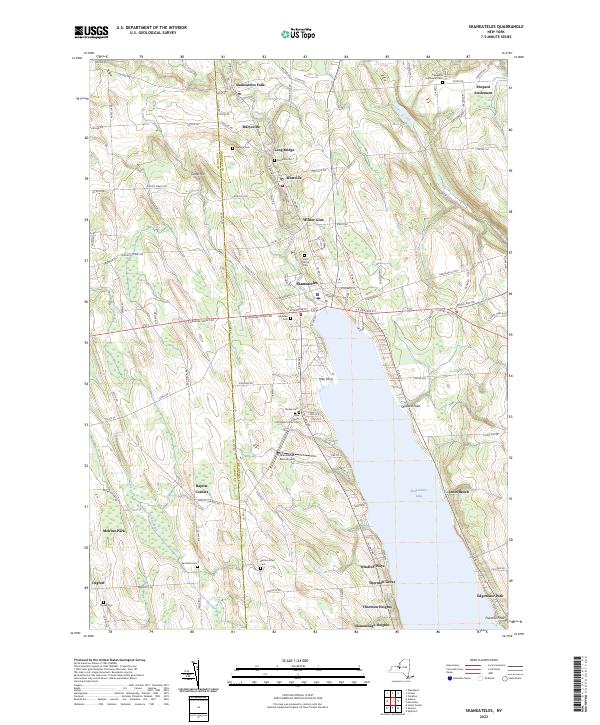
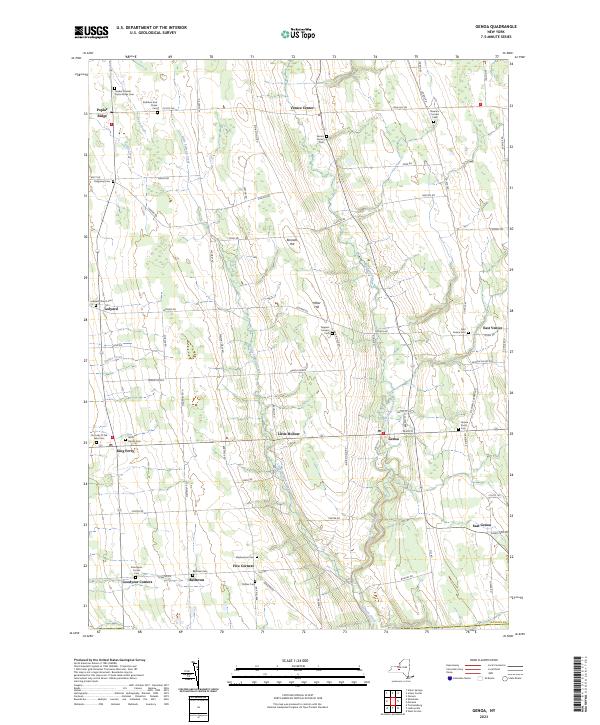
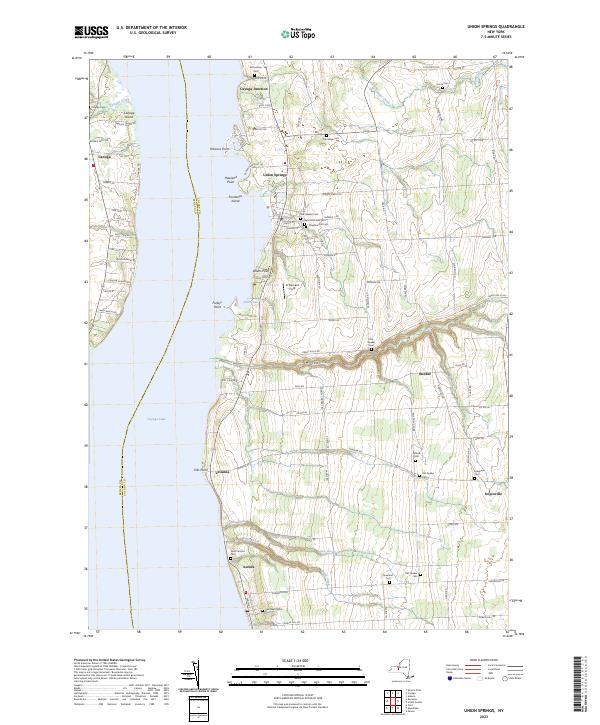
Layered geospatial PDF 7.5 Minute Quadrangle Map. Layers of geospatial data include orthoimagery, roads, grids, geographic names, elevation contours, hydrography, and other selected map features. This map is derived from GIS (geospatial information system) data. It represents a repackaging of GIS data in traditional map form, not creation of new information. The geospatial data in this map are from selected National Map data holdings and other government sources.
Layered geospatial PDF 7.5 Minute Quadrangle Map. Layers of geospatial data include orthoimagery, roads, grids, geographic names, elevation contours, hydrography, and other selected map features. This map is derived from GIS (geospatial information system) data. It represents a repackaging of GIS data in traditional map form, not creation of new information. The geospatial data in this map are from selected National Map data holdings and other government sources.
Layered geospatial PDF 7.5 Minute Quadrangle Map. Layers of geospatial data include orthoimagery, roads, grids, geographic names, elevation contours, hydrography, and other selected map features. This map is derived from GIS (geospatial information system) data. It represents a repackaging of GIS data in traditional map form, not creation of new information. The geospatial data in this map are from selected National Map data holdings and other government sources.
Layered geospatial PDF 7.5 Minute Quadrangle Map. Layers of geospatial data include orthoimagery, roads, grids, geographic names, elevation contours, hydrography, and other selected map features. This map is derived from GIS (geospatial information system) data. It represents a repackaging of GIS data in traditional map form, not creation of new information. The geospatial data in this map are from selected National Map data holdings and other government sources.
This child item dataset contains a shapefile that delineates the surficial geology of the Owasco Inlet watershed.
Categories: Data;
Types: Downloadable,
Map Service,
OGC WFS Layer,
OGC WMS Layer,
Shapefile;
Tags: Aquifer Mapping,
Basin & Hydrogeologic Characterization,
Cayuga County,
Freeville,
Groton,
This child item dataset contains a shapefile that delineates the Owasco Inlet watershed.
Categories: Data;
Types: Downloadable,
Map Service,
OGC WFS Layer,
OGC WMS Layer,
Shapefile;
Tags: Aquifer Mapping,
Basin & Hydrogeologic Characterization,
Cayuga County,
Freeville,
Groton,
This child item dataset contains a shapefile that delineates areas of known or inferred confined aquifers within the Owasco Inlet watershed.
Categories: Data;
Types: Downloadable,
Map Service,
OGC WFS Layer,
OGC WMS Layer,
Shapefile;
Tags: Aquifer Mapping,
Basin & Hydrogeologic Characterization,
Cayuga County,
Freeville,
Groton,
This U.S. Geological Survey (USGS) data release contains phytoplankton classification and enumeration results from near-surface samples analyzed by imaging flow cytometry and collected as part of a harmful algae bloom (HAB) monitoring study conducted in collaboration with the New York State Department of Environmental Conservation (NYSDEC). Samples were collected biweekly from monitoring platforms in Owasco and Seneca Lakes and one bloom sample site at Emerson Park Boat Launch in Owasco Lake. The platforms were deployed from June-October in 2020. This dataset includes all routine and quality assurance/quality control samples collected at the three sampling locations. Phytoplankton were identified to the lowest possible...
Categories: Data;
Tags: Algae,
Algae,
Cayuga County,
Division,
Ecological Assessment of Human and Natural Impacts,
Layered geospatial PDF 7.5 Minute Quadrangle Map. Layers of geospatial data include orthoimagery, roads, grids, geographic names, elevation contours, hydrography, and other selected map features. This map is derived from GIS (geospatial information system) data. It represents a repackaging of GIS data in traditional map form, not creation of new information. The geospatial data in this map are from selected National Map data holdings and other government sources.
Layered geospatial PDF 7.5 Minute Quadrangle Map. Layers of geospatial data include orthoimagery, roads, grids, geographic names, elevation contours, hydrography, and other selected map features. This map is derived from GIS (geospatial information system) data. It represents a repackaging of GIS data in traditional map form, not creation of new information. The geospatial data in this map are from selected National Map data holdings and other government sources.
Layered geospatial PDF 7.5 Minute Quadrangle Map. Layers of geospatial data include orthoimagery, roads, grids, geographic names, elevation contours, hydrography, and other selected map features. This map is derived from GIS (geospatial information system) data. It represents a repackaging of GIS data in traditional map form, not creation of new information. The geospatial data in this map are from selected National Map data holdings and other government sources.
Layered geospatial PDF 7.5 Minute Quadrangle Map. Layers of geospatial data include orthoimagery, roads, grids, geographic names, elevation contours, hydrography, and other selected map features. This map is derived from GIS (geospatial information system) data. It represents a repackaging of GIS data in traditional map form, not creation of new information. The geospatial data in this map are from selected National Map data holdings and other government sources.
This child item dataset contains a shapefile that delineates ice-margin positions in the Owasco Inlet watershed and surrounding area. Ice positions mostly represent pauses during the final retreat of the ice sheet from the area. Ice-margin positions are delineated by moraines (mostly till) in upland areas and by ice-contact deposits in the valleys.
Categories: Data;
Types: Downloadable,
Map Service,
OGC WFS Layer,
OGC WMS Layer,
Shapefile;
Tags: Aquifer Mapping,
Basin & Hydrogeologic Characterization,
Cayuga County,
Freeville,
Groton,
Layered geospatial PDF 7.5 Minute Quadrangle Map. Layers of geospatial data include orthoimagery, roads, grids, geographic names, elevation contours, hydrography, and other selected map features. This map is derived from GIS (geospatial information system) data. It represents a repackaging of GIS data in traditional map form, not creation of new information. The geospatial data in this map are from selected National Map data holdings and other government sources.
Layered geospatial PDF 7.5 Minute Quadrangle Map. Layers of geospatial data include orthoimagery, roads, grids, geographic names, elevation contours, hydrography, and other selected map features. This map is derived from GIS (geospatial information system) data. It represents a repackaging of GIS data in traditional map form, not creation of new information. The geospatial data in this map are from selected National Map data holdings and other government sources.
Layered geospatial PDF 7.5 Minute Quadrangle Map. Layers of geospatial data include orthoimagery, roads, grids, geographic names, elevation contours, hydrography, and other selected map features. This map is derived from GIS (geospatial information system) data. It represents a repackaging of GIS data in traditional map form, not creation of new information. The geospatial data in this map are from selected National Map data holdings and other government sources.
Layered geospatial PDF 7.5 Minute Quadrangle Map. Layers of geospatial data include orthoimagery, roads, grids, geographic names, elevation contours, hydrography, and other selected map features. This map is derived from GIS (geospatial information system) data. It represents a repackaging of GIS data in traditional map form, not creation of new information. The geospatial data in this map are from selected National Map data holdings and other government sources.
Layered geospatial PDF 7.5 Minute Quadrangle Map. Layers of geospatial data include orthoimagery, roads, grids, geographic names, elevation contours, hydrography, and other selected map features. This map is derived from GIS (geospatial information system) data. It represents a repackaging of GIS data in traditional map form, not creation of new information. The geospatial data in this map are from selected National Map data holdings and other government sources.
|

|
