Filters: Tags: Chenango County (X)
69 results (148ms)|
Filters
Date Range
Extensions Types
Contacts
Categories Tag Types
|
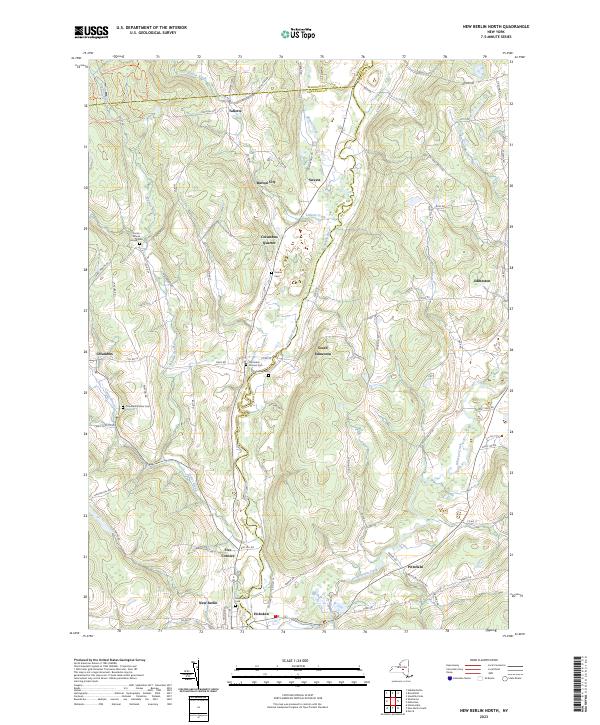
Layered geospatial PDF 7.5 Minute Quadrangle Map. Layers of geospatial data include orthoimagery, roads, grids, geographic names, elevation contours, hydrography, and other selected map features. This map is derived from GIS (geospatial information system) data. It represents a repackaging of GIS data in traditional map form, not creation of new information. The geospatial data in this map are from selected National Map data holdings and other government sources.
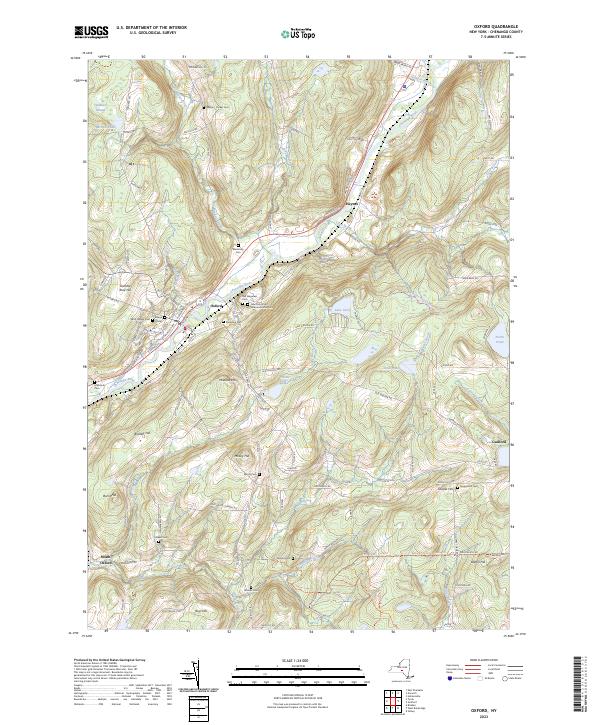
Layered geospatial PDF 7.5 Minute Quadrangle Map. Layers of geospatial data include orthoimagery, roads, grids, geographic names, elevation contours, hydrography, and other selected map features. This map is derived from GIS (geospatial information system) data. It represents a repackaging of GIS data in traditional map form, not creation of new information. The geospatial data in this map are from selected National Map data holdings and other government sources.
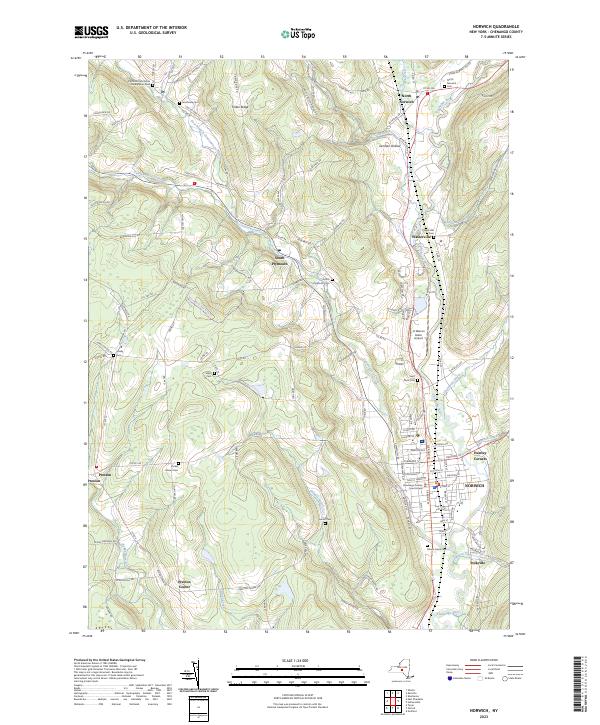
Layered geospatial PDF 7.5 Minute Quadrangle Map. Layers of geospatial data include orthoimagery, roads, grids, geographic names, elevation contours, hydrography, and other selected map features. This map is derived from GIS (geospatial information system) data. It represents a repackaging of GIS data in traditional map form, not creation of new information. The geospatial data in this map are from selected National Map data holdings and other government sources.
This dataset includes spreadsheets with statistical data (mean and median absolute error) used in deciding which interpolation method best fit the corresponding dataset. All statistical data were paired with a visual inspection of the interpolation prior to determining the final raster product. All spreadsheets were generated using an automated python script (Jahn, 2020).
This folder contains water-level recovery data for selected hydraulic tests that support USGS Scientific Investigations Report 2020-5087, "Transmissivity Estimated from Brief Pumping Tests of Domestic Wells and Compared with Bedrock Lithofacies and Position on Hillsides in the Appalachian Plateau of New York." These data are part of a data release that contains observed water-level recovery data in 52 wells, matched to theoretical type curves defined by postulated values of aquifer transmissivity and storage, that together constitute the database for USGS Scientific Investigations Report 2020-5087. The water-level recovery data were collected after 13 to 132 seconds of pumping. Five of the wells were also test-pumped...
Layered geospatial PDF 7.5 Minute Quadrangle Map. Layers of geospatial data include orthoimagery, roads, grids, geographic names, elevation contours, hydrography, and other selected map features. This map is derived from GIS (geospatial information system) data. It represents a repackaging of GIS data in traditional map form, not creation of new information. The geospatial data in this map are from selected National Map data holdings and other government sources.
Layered geospatial PDF 7.5 Minute Quadrangle Map. Layers of geospatial data include orthoimagery, roads, grids, geographic names, elevation contours, hydrography, and other selected map features. This map is derived from GIS (geospatial information system) data. It represents a repackaging of GIS data in traditional map form, not creation of new information. The geospatial data in this map are from selected National Map data holdings and other government sources.
Layered geospatial PDF 7.5 Minute Quadrangle Map. Layers of geospatial data include orthoimagery, roads, grids, geographic names, elevation contours, hydrography, and other selected map features. This map is derived from GIS (geospatial information system) data. It represents a repackaging of GIS data in traditional map form, not creation of new information. The geospatial data in this map are from selected National Map data holdings and other government sources.
Layered geospatial PDF 7.5 Minute Quadrangle Map. Layers of geospatial data include orthoimagery, roads, grids, geographic names, elevation contours, hydrography, and other selected map features. This map is derived from GIS (geospatial information system) data. It represents a repackaging of GIS data in traditional map form, not creation of new information. The geospatial data in this map are from selected National Map data holdings and other government sources.
Layered geospatial PDF 7.5 Minute Quadrangle Map. Layers of geospatial data include orthoimagery, roads, grids, geographic names, elevation contours, hydrography, and other selected map features. This map is derived from GIS (geospatial information system) data. It represents a repackaging of GIS data in traditional map form, not creation of new information. The geospatial data in this map are from selected National Map data holdings and other government sources.

In the Chenango River Basin, New York, glacial valley-fill unconfined and confined aquifers are an important source of drinking-water supplies. The U.S. Geological Survey developed three-dimensional groundwater-flow models (MODFLOW-NWT code) of three study areas in the basin to improve understanding of groundwater flow and delineate areas contributing recharge to 16 production wells as part of an effort to protect the source of water to these wells. The modeled areas were the Cortland study area in Cortland County (CCSA), Greene study area (GSA), and the Cincinnatus study area (CSA). Production wells in CCSA tap unconfined aquifers, whereas the production wells in GSA and CSA are screened in confined aquifers. The...
Digital hydrogeologic datasets were developed for the Greene study area in upstate New York in cooperation with the New York State Department of Environmental Conservation. These datasets define the hydrogeologic framework of the valley-fill aquifer and surrounding till-covered uplands within the study area. Datasets include: bedrock elevation raster, lacustrine silt and clay top and bottom elevation rasters, lidar minimum elevation raster, lacustrine extent polygon, valley-fill extent polygon, and surficial geology polygons. Elevation layers were interpolated at 125-foot discretization to match the model grid cell size.
Layered geospatial PDF 7.5 Minute Quadrangle Map. Layers of geospatial data include orthoimagery, roads, grids, geographic names, elevation contours, hydrography, and other selected map features. This map is derived from GIS (geospatial information system) data. It represents a repackaging of GIS data in traditional map form, not creation of new information. The geospatial data in this map are from selected National Map data holdings and other government sources.
Layered geospatial PDF 7.5 Minute Quadrangle Map. Layers of geospatial data include orthoimagery, roads, grids, geographic names, elevation contours, hydrography, and other selected map features. This map is derived from GIS (geospatial information system) data. It represents a repackaging of GIS data in traditional map form, not creation of new information. The geospatial data in this map are from selected National Map data holdings and other government sources.
Layered geospatial PDF 7.5 Minute Quadrangle Map. Layers of geospatial data include orthoimagery, roads, grids, geographic names, elevation contours, hydrography, and other selected map features. This map is derived from GIS (geospatial information system) data. It represents a repackaging of GIS data in traditional map form, not creation of new information. The geospatial data in this map are from selected National Map data holdings and other government sources.
Layered geospatial PDF 7.5 Minute Quadrangle Map. Layers of geospatial data include orthoimagery, roads, grids, geographic names, elevation contours, hydrography, and other selected map features. This map is derived from GIS (geospatial information system) data. It represents a repackaging of GIS data in traditional map form, not creation of new information. The geospatial data in this map are from selected National Map data holdings and other government sources.
Layered geospatial PDF 7.5 Minute Quadrangle Map. Layers of geospatial data include orthoimagery, roads, grids, geographic names, elevation contours, hydrography, and other selected map features. This map is derived from GIS (geospatial information system) data. It represents a repackaging of GIS data in traditional map form, not creation of new information. The geospatial data in this map are from selected National Map data holdings and other government sources.
This dataset includes georeferenced tiff files from two separate reports for the Greene study area, where appropriate data have been digitized into feature classes within ArcGIS. Not all digitized and georeferenced data was necessarily used in the final interpolations, however they may have contributed to understanding the local hydrogeology
Layered geospatial PDF 7.5 Minute Quadrangle Map. Layers of geospatial data include orthoimagery, roads, grids, geographic names, elevation contours, hydrography, and other selected map features. This map is derived from GIS (geospatial information system) data. It represents a repackaging of GIS data in traditional map form, not creation of new information. The geospatial data in this map are from selected National Map data holdings and other government sources.
Layered geospatial PDF 7.5 Minute Quadrangle Map. Layers of geospatial data include orthoimagery, roads, grids, geographic names, elevation contours, hydrography, and other selected map features. This map is derived from GIS (geospatial information system) data. It represents a repackaging of GIS data in traditional map form, not creation of new information. The geospatial data in this map are from selected National Map data holdings and other government sources.
|

|
