Filters: Tags: Chinook (X)
23 results (50ms)|
Filters
Date Range
Extensions Types Contacts
Categories Tag Types Tag Schemes |
These GIS data contain stream reaches that were identified as habitat areas for the Lower Columbia River Chinook Salmon (CKLCR) and Upper Willamette River Chinook Salmon (CKUWR) Evolutionarily Significant Unit (ESU).WOPR: (Western Oregon Plan Revision) PRMP: (Proposed Resource Management Plan) Chinook Salmon Columbia River Willamete River CHART: (Critical Habitat Analytical Review Teams) PCE: (Primary Constituent Elements) This data is a PRMP release version of the data fsh_aa_a_chinnok_chart_arc. These data were used in the critical habitat analysis conducted by National Marine Fisheries Service's Critical Habitat Analytical Review Teams. The analysis was conducted as part of the rule making process for critical...
USGS Historical Quadrangle in GeoPDF.
USGS Historical Quadrangle in GeoPDF.
This data set contains imagery from the National Agriculture Imagery Program (NAIP). The NAIP program is administered by USDA FSA and has been established to support two main FSA strategic goals centered on agricultural production. These are, increase stewardship of America's natural resources while enhancing the environment, and to ensure commodities are procured and distributed effectively and efficiently to increase food security. The NAIP program supports these goals by acquiring and providing ortho imagery that has been collected during the agricultural growing season in the U.S. The NAIP ortho imagery is tailored to meet FSA requirements and is a fundamental tool used to support FSA farm and conservation programs....
This data set contains imagery from the National Agriculture Imagery Program (NAIP). The NAIP program is administered by USDA FSA and has been established to support two main FSA strategic goals centered on agricultural production. These are, increase stewardship of America's natural resources while enhancing the environment, and to ensure commodities are procured and distributed effectively and efficiently to increase food security. The NAIP program supports these goals by acquiring and providing ortho imagery that has been collected during the agricultural growing season in the U.S. The NAIP ortho imagery is tailored to meet FSA requirements and is a fundamental tool used to support FSA farm and conservation programs....
This data set contains imagery from the National Agriculture Imagery Program (NAIP). The NAIP program is administered by USDA FSA and has been established to support two main FSA strategic goals centered on agricultural production. These are, increase stewardship of America's natural resources while enhancing the environment, and to ensure commodities are procured and distributed effectively and efficiently to increase food security. The NAIP program supports these goals by acquiring and providing ortho imagery that has been collected during the agricultural growing season in the U.S. The NAIP ortho imagery is tailored to meet FSA requirements and is a fundamental tool used to support FSA farm and conservation programs....
This data set contains imagery from the National Agriculture Imagery Program (NAIP). The NAIP program is administered by USDA FSA and has been established to support two main FSA strategic goals centered on agricultural production. These are, increase stewardship of America's natural resources while enhancing the environment, and to ensure commodities are procured and distributed effectively and efficiently to increase food security. The NAIP program supports these goals by acquiring and providing ortho imagery that has been collected during the agricultural growing season in the U.S. The NAIP ortho imagery is tailored to meet FSA requirements and is a fundamental tool used to support FSA farm and conservation programs....
USGS Historical Quadrangle in GeoPDF.
This data set contains imagery from the National Agriculture Imagery Program (NAIP). The NAIP program is administered by USDA FSA and has been established to support two main FSA strategic goals centered on agricultural production. These are, increase stewardship of America's natural resources while enhancing the environment, and to ensure commodities are procured and distributed effectively and efficiently to increase food security. The NAIP program supports these goals by acquiring and providing ortho imagery that has been collected during the agricultural growing season in the U.S. The NAIP ortho imagery is tailored to meet FSA requirements and is a fundamental tool used to support FSA farm and conservation programs....
Evolutionarily Significant Unit (ESU) boundaries for Anadromous fish within the Western Oregon Plan Revision (WOPR) project area. Shows areas where species is a candidate or non-warranted along with threatened or endangered.BLM (Bureau of Land Management) WOPR (Western Oregon Plan Revision) FSH (Fish) PRMP (Proposed Resource Management Plan) ESU (Envolutionarily Significant Unit) NOAA (National Oceanic and Atmospheric Administration) This data is a PRMP release version of the data fsh_as_a_chinook_esu_poly.
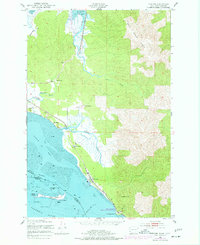
USGS Historical Quadrangle in GeoPDF.
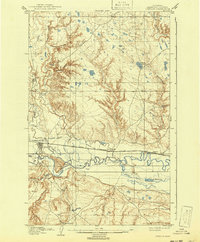
USGS Historical Quadrangle in GeoPDF.
This data set contains imagery from the National Agriculture Imagery Program (NAIP). The NAIP program is administered by USDA FSA and has been established to support two main FSA strategic goals centered on agricultural production. These are, increase stewardship of America's natural resources while enhancing the environment, and to ensure commodities are procured and distributed effectively and efficiently to increase food security. The NAIP program supports these goals by acquiring and providing ortho imagery that has been collected during the agricultural growing season in the U.S. The NAIP ortho imagery is tailored to meet FSA requirements and is a fundamental tool used to support FSA farm and conservation programs....
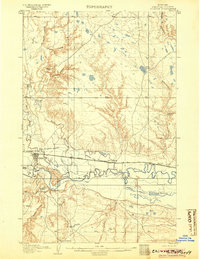
USGS Historical Quadrangle in GeoPDF.
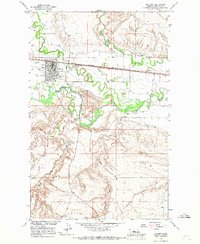
USGS Historical Quadrangle in GeoPDF.
This data set contains imagery from the National Agriculture Imagery Program (NAIP). The NAIP program is administered by USDA FSA and has been established to support two main FSA strategic goals centered on agricultural production. These are, increase stewardship of America's natural resources while enhancing the environment, and to ensure commodities are procured and distributed effectively and efficiently to increase food security. The NAIP program supports these goals by acquiring and providing ortho imagery that has been collected during the agricultural growing season in the U.S. The NAIP ortho imagery is tailored to meet FSA requirements and is a fundamental tool used to support FSA farm and conservation programs....
State of the Salmon GIS staff appended, cleaned, and clipped the basins to the North Pacific extent area. This coverage was then edited, by manual digitizing, checking accuracy against a 1:1,000,000 streams coverage, digital elevation models, and 4th field watershed boundaries where available. This process mostly entailed eliminating erroneous inclusion and exclusion of upper stream reaches within Hydro1k boundaries. When more detailed streams were consulted in the Pacific Northwest, Hydro1k basins could have been refined further and were in the cases when it affected distribution of salmonids at the time of processing (Summer 2004). This finer resolution stream data was not used extensively to maintain a consistent...
Categories: Data;
Types: Downloadable,
Map Service,
OGC WFS Layer,
OGC WMS Layer,
Shapefile;
Tags: Oncorhynchus tschawytscha,
Anadromous Resources,
Chinook,
Chum,
Coho,
The geographic distribution of stream reaches with potential to support high quality habitat for salmonids has bearing on the actual status of habitats and populations over broad spatial extents. As part of the Coastal Landscape Analysis and Modeling Study (CLAMS), we examined how salmon-habitat potential was distributed relative to current and future (+100 years) landscape characteristics in the Coastal Province of Oregon, USA. The intrinsic potential to provide high-quality rearing habitat was modeled for juvenile coho salmon (Oncorhynchus kisutch) and juvenile steelhead (O. mykiss) based on stream flow, valley constraint, and stream gradient. See Supplemental Information for additional detail. BLM (Bureau of...
|

|
