Filters: Tags: Climate (X)
3,150 results (15ms)|
Filters
Date Range
Extensions Types Contacts
Categories Tag Types
|

For his MS thesis, Brendan Rogers used climate data from the PRISM group (Chris Daly, Oregon State University) at a 30arc second (800m) spatial grain across the western 2/3 of the states of Oregon and Washington to generate a climatology or baseline. He then created future climate change scenarios using statistical downscaling to create anomalies from three General Circulation Models (CSIRO Mk3, MIROC 3.2 medres, and Hadley CM 3), each run through three CO2 emission scenarios (SRES B1, A1B, and A2).

This dataset represents the difference between future and historic maximum temperatures under the CSIRO A2 future climate scenario.

This data was produced by MC1 version B41, under the MIROC A2 future climate scenario.

These maps are a digital representation of the individual tree species range maps of the Atlas of the United States Trees by Elbert L. Little, Jr. The atlas shows the natural distribution or range of the native tree species of North America. These coverages represent 3 volumes of the atlas.

These maps are a digital representation of the individual tree species range maps of the Atlas of the United States Trees by Elbert L. Little, Jr. The atlas shows the natural distribution or range of the native tree species of North America. These coverages represent 3 volumes of the atlas.

Modal vegetation class over 1986 – 2005, simulated with MC1 (Lenihan et al. 2008) and a 10 km x 10 km grid cell size. Grid Value: Vegetation Type 1: ALPINE 2: SUBALPINE FOREST 3: COAST EVERGREEN FOREST 11: PINYON-JUNIPER 4: SIERRAN EVERGREEN FOREST 6: MIXED EVERGREEN FOREST 15: GREAT BASIN EVERGREEN WOODLAND 10: MIXED EVERGREEN WOODLAND 20: SAGEBRUSH STEPPE 17: C3 GRASSLAND 18: C4 GRASSLAND 19: CHAPARRAL 17: C3 GRASSLAND 18: C4 GRASSLAND 21: DESERT

These maps are a digital representation of the individual tree species range maps of the Atlas of the United States Trees by Elbert L. Little, Jr. The atlas shows the natural distribution or range of the native tree species of North America. These coverages represent 3 volumes of the atlas. Little's tree extent maps can be found in the Data Basin gallery here: http://app.databasin.org/app/pages/galleryPage.jsp?id=5e449f3c91304f498a96299a9d5460a3

For his MS thesis, Brendan Rogers used the vegetation model MC1 to simulate vegetation dynamics, associated carbon and nitrogen cycle, water budget and wild fire impacts across the western 2/3 of the states of Oregon and Washington using climate input data from the the PRISM group (Chris Daly, OSU) at a 30arc second (800m) spatial grain. The model was run from 1895 to 2100 assuming that nitrogen demand from the plants was always met so that the nitrogen concentrations in various plant parts never dropped below their minimum reported values. A CO2 enhancement effect increased productivity and water use efficiency as the atmospheric CO2 concentration increased. Future climate change scenarios were generated through...

The North American Regional Climate Change Assessment Program (NARCCAP) is an international program that will serve the climate scenario needs of the United States, Canada, and northern Mexico. NARCCAP is systematically investigating the uncertainties in future climate projections on the regional level. NARCCAP closely matches the regional climate models (RCMs) with multiple atmosphere-ocean general circulation models (AOGCMs) along with the A2 scenario from the Special Report on Emission Scenarios (SRES) over an area covering most of North America. NARCCAP also validates the regional climate model performance by driving the RCMs with reanalyses, which is similar to driving the models with observations. The basic...

This map represents the mean annual value of total ecosystem carbon, simulated by the model MC1 for the 30-year period 1971-2000. The data is from output variable C_ECOSYS in MC1 version B60. The data is in units of grams of carbon per square meter; values range from 6739 to 77570 g C m-2. The mean value is 35184 g C m-2. The dynamic global vegetation model MC1 (e.g. Bachelet et al. 2001) was used to simulate vegetation dynamics, associated carbon and nitrogen cycle, water budget, and wild fire impacts at two study sites in eastern Oregon (Deschutes and Fremont-Winema National Forests) and in Arizona (Apache Sitgreaves National Forest area) in the context of a project funded by the USDA Forest Service (PNW 09-JV-11261900-003)....

Simulated average maximum tree LAI (m2/m2) averaged over 2076-2095 simulated by the MC1 dynamic global vegetation model (Bachelet et al. 2001) at a 800 m x 800 m spatial resolution using future climate projections provided through CMIP3 (http://www-pcmdi.llnl.gov/ipcc/about_ipcc.php). Future climate drivers were generated using statistical downscaling (simple delta method) of general circulation model projections, in this case Hadley CM3 (Johns et al. 2003) under the A2 emission scenario (Naki?enovi? et al. 2000). The deltas (differences for temperatures and ratios for precipitation) were used to modify PRISM 800 m historical baseline (Daly et al. 2008). Note: The MC1 model is described in data basin (http://databasin.org/climate-center/features/mc1-dynamic-global-vegetation-...

Simulated annual precipitation (mm) averaged over 2076-2095 simulated by the MC1 dynamic global vegetation model (Bachelet et al. 2001) at a 800 m x 800 m spatial resolution using future climate projections provided through CMIP3 (http://www-pcmdi.llnl.gov/ipcc/about_ipcc.php). Future climate drivers were generated using statistical downscaling (simple delta method) of general circulation model projections, in this case MIROC 3.2 medres (Hasumi and Emori 2004) under the A2 emission scenario (Naki?enovi? et al. 2000). The deltas (differences for temperatures and ratios for precipitation) were used to modify PRISM 800 m historical baseline (Daly et al. 2008). Note: The MC1 model is described in data basin (http://databasin.org/climate-center/features/mc1-dynamic-global-vegetati...
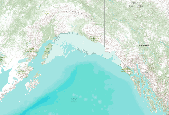
This dataset represents the soil water storage capacity (AWS in mm at 0.25 m depth) from SSURGO and STATSGO soil descriptions for soil map units in the state of southern Alaska that lie within the North Pacific Landscape Conservation Cooperative. Available Water Storage 0-25 cm - Weighted Average (centimeters). Available water storage (AWS). The volume of water that the soil, to a depth of 25 centimeters, can store that is available to plants. It is reported as the weighted average of all components in the map unit, and is expressed as centimeters of water. AWS is calculated from AWC (available water capacity) which is commonly estimated as the difference between the water contents at 1/10 or 1/3 bar (field capacity)...

This dataset represents the soil water storage capacity (AWS in mm at 0.5 m depth) from SSURGO and STATSGO soil descriptions for soil map units in the state of southern Alaska that lie within the North Pacific Landscape Conservation Cooperative. Available Water Storage 0-50 cm - Weighted Average (centimeters). Available water storage (AWS). The volume of water that the soil, to a depth of 50 centimeters, can store that is available to plants. It is reported as the weighted average of all components in the map unit, and is expressed as centimeters of water. AWS is calculated from AWC (available water capacity) which is commonly estimated as the difference between the water contents at 1/10 or 1/3 bar (field capacity)...

This data set contains spatially gridded average monthly and annual maximum temperature for the climatological period 1971-2000. Distribution of the point measurements to a spatial grid was accomplished using the PRISM model, developed and applied by Chris Daly of the PRISM Climate Group at Oregon State University.

This dataset represents the difference between future and historic maximum temperatures under the MIROC A2 future climate scenario.
Future climates are simulated by general circulation models (GCM) using climate change scenarios (IPCC 2014). To project climate change for the sagebrush biome, we used 11 GCMs and two climate change scenarios from the IPCC Fifth Assessment, representative concentration pathways (RCPs) 4.5 and 8.5 (Moss et al. 2010, Van Vuuren et al. 2011). RCP4.5 scenario represents a future where climate policies limit and achieve stabilization of greenhouse gas concentrations to 4.5 W m-2 by 2100. RCP8.5 scenario might be called a business-as-usual scenario, where high emissions of greenhouse gases continue in the absence of climate change policies. The two selected time frames allow comparison of near-term (2020-2050) and longer-term...
Categories: Data;
Types: Citation,
Downloadable,
GeoTIFF,
Map Service,
Raster;
Tags: Arizona,
CRS,
California,
Climate,
Colorado,
These data represent simulated soil temperature and moisture conditions for current climate, and for future climate represented by all available climate models at two time periods during the 21st century. These data were used to: 1) quantify the direction and magnitude of expected changes in several measures of soil temperature and soil moisture, including the key variables used to distinguish the regimes used in the R and R categories; 2) assess how these changes will impact the geographic distribution of soil temperature and moisture regimes; and 3) explore the implications for using R and R categories for estimating future ecosystem resilience and resistance.
|

|
