Filters: Tags: Coeur D'Alene (X)
14 results (23ms)|
Filters
Date Range
Types Contacts
Categories Tag Types Tag Schemes |
Weighted Regressions on Time, Discharge and Season (WRTDS) and WRTDS with Kalman filtering (WRTDS_K) models were developed for total and dissolved cadmium, zinc and lead; total phosphorus and nitrogen; and dissolved orthophosphate at twelve sites in the Spokane River watershed, northern Idaho, for water years 1990 to 2018. The data table contains the annual mean concentrations and annual total loads estimated by WRTDS_K, and the flow-normalized annual mean concentrations and flow-normalized annual total loads estimated by WRTDS for each modeled site and constituent.
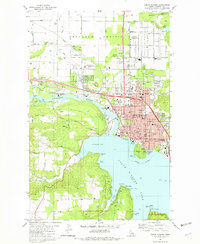
USGS Historical Quadrangle in GeoPDF.
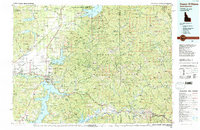
USGS Historical Quadrangle in GeoPDF.
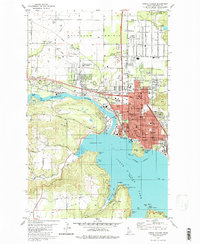
USGS Historical Quadrangle in GeoPDF.
This data set contains imagery from the National Agriculture Imagery Program (NAIP). The NAIP program is administered by USDA FSA and has been established to support two main FSA strategic goals centered on agricultural production. These are, increase stewardship of America's natural resources while enhancing the environment, and to ensure commodities are procured and distributed effectively and efficiently to increase food security. The NAIP program supports these goals by acquiring and providing ortho imagery that has been collected during the agricultural growing season in the U.S. The NAIP ortho imagery is tailored to meet FSA requirements and is a fundamental tool used to support FSA farm and conservation programs....
This data set contains imagery from the National Agriculture Imagery Program (NAIP). The NAIP program is administered by USDA FSA and has been established to support two main FSA strategic goals centered on agricultural production. These are, increase stewardship of America's natural resources while enhancing the environment, and to ensure commodities are procured and distributed effectively and efficiently to increase food security. The NAIP program supports these goals by acquiring and providing ortho imagery that has been collected during the agricultural growing season in the U.S. The NAIP ortho imagery is tailored to meet FSA requirements and is a fundamental tool used to support FSA farm and conservation programs....
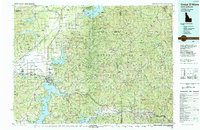
USGS Historical Quadrangle in GeoPDF.
USGS Historical Quadrangle in GeoPDF.
Weighted Regressions on Time, Discharge and Season (WRTDS) models were developed for total and dissolved cadmium, lead and zinc; total phosphorus and nitrogen; and dissolved orthophosphate at twelve sites in the Spokane River watershed for water years 1990 to 2018. Bootstrapped model replicates were run to determine the statistical likelihoods of trends in flow-normalized concentrations and loads over the period of record and water years 2009-2018 for each constituent at each site. The data table contains the change in concentrations and loads and the numeric and descriptive statistical likelihoods associated with the trends over the two time periods for each constituent and site.
USGS Historical Quadrangle in GeoPDF.
USGS Historical Quadrangle in GeoPDF.
|

|
