Filters: Tags: Columbia River (X)
78 results (17ms)|
Filters
Date Range
Extensions Types
Contacts
Categories Tag Types
|
This data contains information of PIT tagged mountain whitefish detections at PIT tag interrogators in the Methow, Columbia and Entiait, rivers. This data was downloaded from the PTAGIS database at www.ptagis.org.
Categories: Data;
Tags: Columbia River,
Data Visualization & Tools,
Entiat River,
Fish,
Methow River,
This portion of the data release presents the locations of the temporary ground control points (GCPs) used for the structure-from-motion (SfM) processing of the imagery collected during the August 2017 unoccupied aerial system (UAS) surveys of the ocean beach at Fort Stevens State Park, OR, and Benson Beach at Cape Disappointment State Park, WA. Eighteen temporary ground control points (GCPs) were distributed throughout the survey area to establish survey control. The GCPs consisted of a combination of small square tarps with black-and-white cross patterns and "X" marks placed on the ground using temporary chalk. The GCP positions were measured using dual-frequency real-time kinematic (RTK) or post-processed kinematic...
Categories: Data;
Tags: Bathymetry and Elevation,
Benson Beach,
CHMRP,
Cape Disappointment,
Clatsop County,
This portion of the USGS data release presents topography data collected during surveys performed in the Columbia River littoral cell, Washington and Oregon, in 2015 (USGS Field Activity Number 2015-647-FA). Topographic profiles were collected by walking along survey lines with global navigation satellite system (GNSS) receivers mounted on backpacks. Prior to data collection, vertical distances between the GNSS antennas and the ground were measured using a tape measure. Hand-held data collectors were used to log raw data and display navigational information allowing surveyors to navigate survey lines spaced at 100- to 1000-m intervals along the beach. Profiles were surveyed from the landward edge of the study area...
Categories: Data;
Types: Map Service,
OGC WFS Layer,
OGC WMS Layer,
OGC WMS Service;
Tags: Bathymetry and Elevation,
CMHRP,
Clatsop County,
Coastal and Marine Hazards and Resources Program,
Columbia River,
This portion of the USGS data release presents topography data collected during surveys performed in the Columbia River littoral cell, Washington and Oregon, in 2022 (USGS Field Activity Number 2022-641-FA). Topographic profiles were collected by walking along survey lines with global navigation satellite system (GNSS) receivers mounted on backpacks. Prior to data collection, vertical distances between the GNSS antennas and the ground were measured using a tape measure. Hand-held data collectors were used to log raw data and display navigational information allowing surveyors to navigate survey lines spaced at 100- to 1000-m intervals along the beach. Profiles were surveyed from the landward edge of the study area...
Categories: Data;
Types: Map Service,
OGC WFS Layer,
OGC WMS Layer,
OGC WMS Service;
Tags: Bathymetry and Elevation,
CMHRP,
Clatsop County,
Coastal and Marine Hazards and Resources Program,
Columbia River,
This data release consists of high quality georeferenced orthophoto mosaics of a 160 kilometer long portion of the Columbia River between Portland and The Dalles, Oregon created from aerial photographs collected in 1935 by the U.S. Army Corps of Engineers. The dataset comprises three GeoTIFF files, each covering about 40-60 kilometers. This metadata document summarizes the entire data release. See attached metadata records for information on the individual mosaics.

These data were released prior to the October 1, 2016 effective date for the USGS’s policy dictating the review, approval, and release of scientific data as referenced in USGS Survey Manual Chapter 502.8 Fundamental Science Practices: Review and Approval of Scientific Data for Release. A digital representation of the watersheds of 43 sites on large river systems sampled by the National Stream Quality Accounting Network (NASQAN) of the U. S. Geological Survey (USGS) in 2000 was created primarily from 1:250,000 hydrologic units(HUCs) in the United States. Watershed information from Canada and Mexico was incorporated to complete the areas draining to the sampling sites from outside the United States. The sampled rivers...
This portion of the USGS data release presents topography data collected during surveys performed in the Columbia River littoral cell, Washington and Oregon, in 2014 (USGS Field Activity Number 2014-631-FA). Topographic profiles were collected by walking along survey lines with global navigation satellite system (GNSS) receivers mounted on backpacks. Prior to data collection, vertical distances between the GNSS antennas and the ground were measured using a tape measure. Hand-held data collectors were used to log raw data and display navigational information allowing surveyors to navigate survey lines spaced at 100- to 1,000-m intervals along the beach. Profiles were surveyed from the landward edge of the study area...
Categories: Data;
Types: Map Service,
OGC WFS Layer,
OGC WMS Layer,
OGC WMS Service;
Tags: Bathymetry and Elevation,
CMHRP,
Clatsop County,
Coastal and Marine Hazards and Resources Program,
Columbia River,
This portion of the USGS data release presents bathymetry data collected during surveys performed in the Columbia River littoral cell, Washington and Oregon in 2015 (USGS Field Activity Number 2015-647-FA). Bathymetry data were collected using four personal watercraft (PWCs) equipped with single-beam sonar systems and global navigation satellite system (GNSS) receivers. The sonar systems consisted of an Odom Echotrac CV-100 single-beam echosounder and 200 kHz transducer with a 9 degree beam angle. Raw acoustic backscatter returns were digitized by the echosounder with a vertical resolution of 1.25 cm. Depths from the echosounders were computed using sound velocity profiles measured using a YSI CastAway CTD during...
Categories: Data;
Types: Map Service,
OGC WFS Layer,
OGC WMS Layer,
OGC WMS Service;
Tags: Bathymetry and Elevation,
CMHRP,
Clatsop County,
Coastal and Marine Hazards and Resources Program,
Columbia River,
This portion of the USGS data release presents bathymetry data collected during surveys performed in the Columbia River littoral cell, Washington and Oregon in 2019 (USGS Field Activity Number 2019-632-FA). Bathymetry data were collected using four personal watercraft (PWCs) equipped with single-beam sonar systems and global navigation satellite system (GNSS) receivers. The sonar systems consisted of an Odom Echotrac CV-100 single-beam echosounder and 200 kHz transducer with a 9 degree beam angle. Raw acoustic backscatter returns were digitized by the echosounder with a vertical resolution of 1.25 cm. Depths from the echosounders were computed using sound velocity profiles measured using a YSI CastAway CTD during...
Categories: Data;
Types: Map Service,
OGC WFS Layer,
OGC WMS Layer,
OGC WMS Service;
Tags: Bathymetry and Elevation,
CMHRP,
Clatsop County,
Coastal and Marine Hazards and Resources Program,
Columbia River,
In May 2023, the U.S. Geological Survey provided training for bathymetric data acquisition and processing for the Iraq Ministry of Water Resources. The training included multibeam sonar theory, survey planning, data collection and processing, and dissemination. This data release presents the raw survey data, a digital elevation model (DEM), and a thalweg shapefile for three survey areas in the Pacific Northwest, USA (Mores Creek, Idaho; Columbia River, OR; Willamette River, OR). Additionally, metadata describes the processing steps, quality assurance and control, and an overall summary of each dataset. The bathymetry point cloud data were collected at selected study sites in the Pacific Northwest, U.S.A, May 2023...
Aquatic invasive species are often transported between water bodies on boats or boat trailers, thus they are considered one of the primary vectors for new introductions of invasive species to a water body. This data set contains geographic positioning system locational data for boater access points, use data (i.e. recreational, fishing), water quality measurements (e.g. calcium concentrations, pH), risk assessment data, and other physical attributes (i.e. size, elevation) where available within the Columbia and Snake Rivers and throughout the Columbia River Basin. This work builds on an earlier body of work by Wells et al. 2011, Prioritizing Zebra and Quagga Mussel Monitoring in the Columbia River Basin (PDF link...
Categories: Data;
Types: Downloadable,
Map Service,
OGC WFS Layer,
OGC WMS Layer,
Shapefile;
Tags: Boat ramps,
Columbia River,
Columbia River Basin,
Dreissenids,
access points,

This service shows the Environmental Sensitivity Index (ESI) developed for the Cook Inlet and Kenai Peninsula, AK, in 2002. Both linear and polygonal shoreline features are included here. Associated GIS datasets can be downloaded here.ESI maps use shoreline rankings to rate how sensitive an area of shoreline would be to an oil spill. The ranking scale goes from 1 to 10.A rank of 1 represents shorelines with the least susceptibility to damage by oiling. Examples include steep, exposed rocky cliffs and banks. The oil cannot penetrate into the rock and will be washed off quickly by the waves and tides.A rank of 10 represents shorelines most likely to be damaged by oiling. Examples include protected, vegetated...
This portion of the data release presents high-resolution orthomosaic images of the ocean beach at Fort Stevens State Park, OR, and Benson Beach at Cape Disappointment State Park, WA. The orthomosaics have resolutions of 5 centimeters per pixel and were derived from structure-from-motion (SfM) processing of aerial imagery collected with unoccupied aerial systems (UAS) during low tide surveys on 22 and 23 July 2021. The raw imagery used to create the orthomosaics was acquired with a UAS fitted with a Ricoh GR II digital camera featuring a global shutter. The UAS was flown on pre-programmed autonomous flight lines spaced to provide approximately 70 percent overlap between images from adjacent lines. The camera was...
Categories: Data;
Tags: Bathymetry and Elevation,
Benson Beach,
CHMRP,
Cape Disappointment,
Clatsop County,
This portion of the USGS data release presents topography data collected during surveys performed in the Columbia River littoral cell, Washington and Oregon, in 2016 (USGS Field Activity Number 2016-663-FA). Topographic profiles were collected by walking along survey lines with global navigation satellite system (GNSS) receivers mounted on backpacks. Prior to data collection, vertical distances between the GNSS antennas and the ground were measured using a tape measure. Hand-held data collectors were used to log raw data and display navigational information allowing surveyors to navigate survey lines spaced at 100- to 1000-m intervals along the beach. Profiles were surveyed from the landward edge of the study area...
Categories: Data;
Types: Map Service,
OGC WFS Layer,
OGC WMS Layer,
OGC WMS Service;
Tags: Bathymetry and Elevation,
CMHRP,
Clatsop County,
Coastal and Marine Hazards and Resources Program,
Columbia River,
This portion of the USGS data release presents topography data collected during surveys performed in the Columbia River littoral cell, Washington and Oregon, in 2023 (USGS Field Activity Number 2023-644-FA). Topographic profiles were collected by walking along survey lines with global navigation satellite system (GNSS) receivers mounted on backpacks. Prior to data collection, vertical distances between the GNSS antennas and the ground were measured using a tape measure. Hand-held data collectors were used to log raw data and display navigational information allowing surveyors to navigate survey lines spaced at 100- to 1000-m intervals along the beach. Profiles were surveyed from the landward edge of the study area...
Categories: Data;
Types: Map Service,
OGC WFS Layer,
OGC WMS Layer,
OGC WMS Service;
Tags: Bathymetry and Elevation,
CMHRP,
Clatsop County,
Coastal and Marine Hazards and Resources Program,
Columbia River,
The U.S. Geological Survey (USGS) compiled data from a variety of national and state agencies to create a comprehensive dataset of streamflow and stage for the lower Columbia River basin and the coasts of Washington, Oregon, and northern California. Seasonal maximum values were calculated for streamflow and stage for the winter (November–March) and spring (April–July) flow seasons, as well as for the full water year (October-September) when underlying data were available.
Categories: Data;
Tags: Columbia River,
Hydrology,
Lower Columbia River Basin,
Northern California,
Oregon,
In May 2023, the U.S. Geological Survey provided training for bathymetric data acquisition and processing for the Iraq Ministry of Water Resources. The training included multibeam sonar theory, survey planning, data collection and processing, and dissemination. This data release presents the raw survey data, a digital elevation model (DEM), and a thalweg shapefile for three survey areas in the Pacific Northwest, USA (Mores Creek, Idaho; Columbia River, OR; Willamette River, OR). Additionally, metadata describes the processing steps, quality assurance and control, and an overall summary of each dataset. The bathymetry point cloud data were collected at selected study sites in the Pacific Northwest, U.S.A, May 2023...
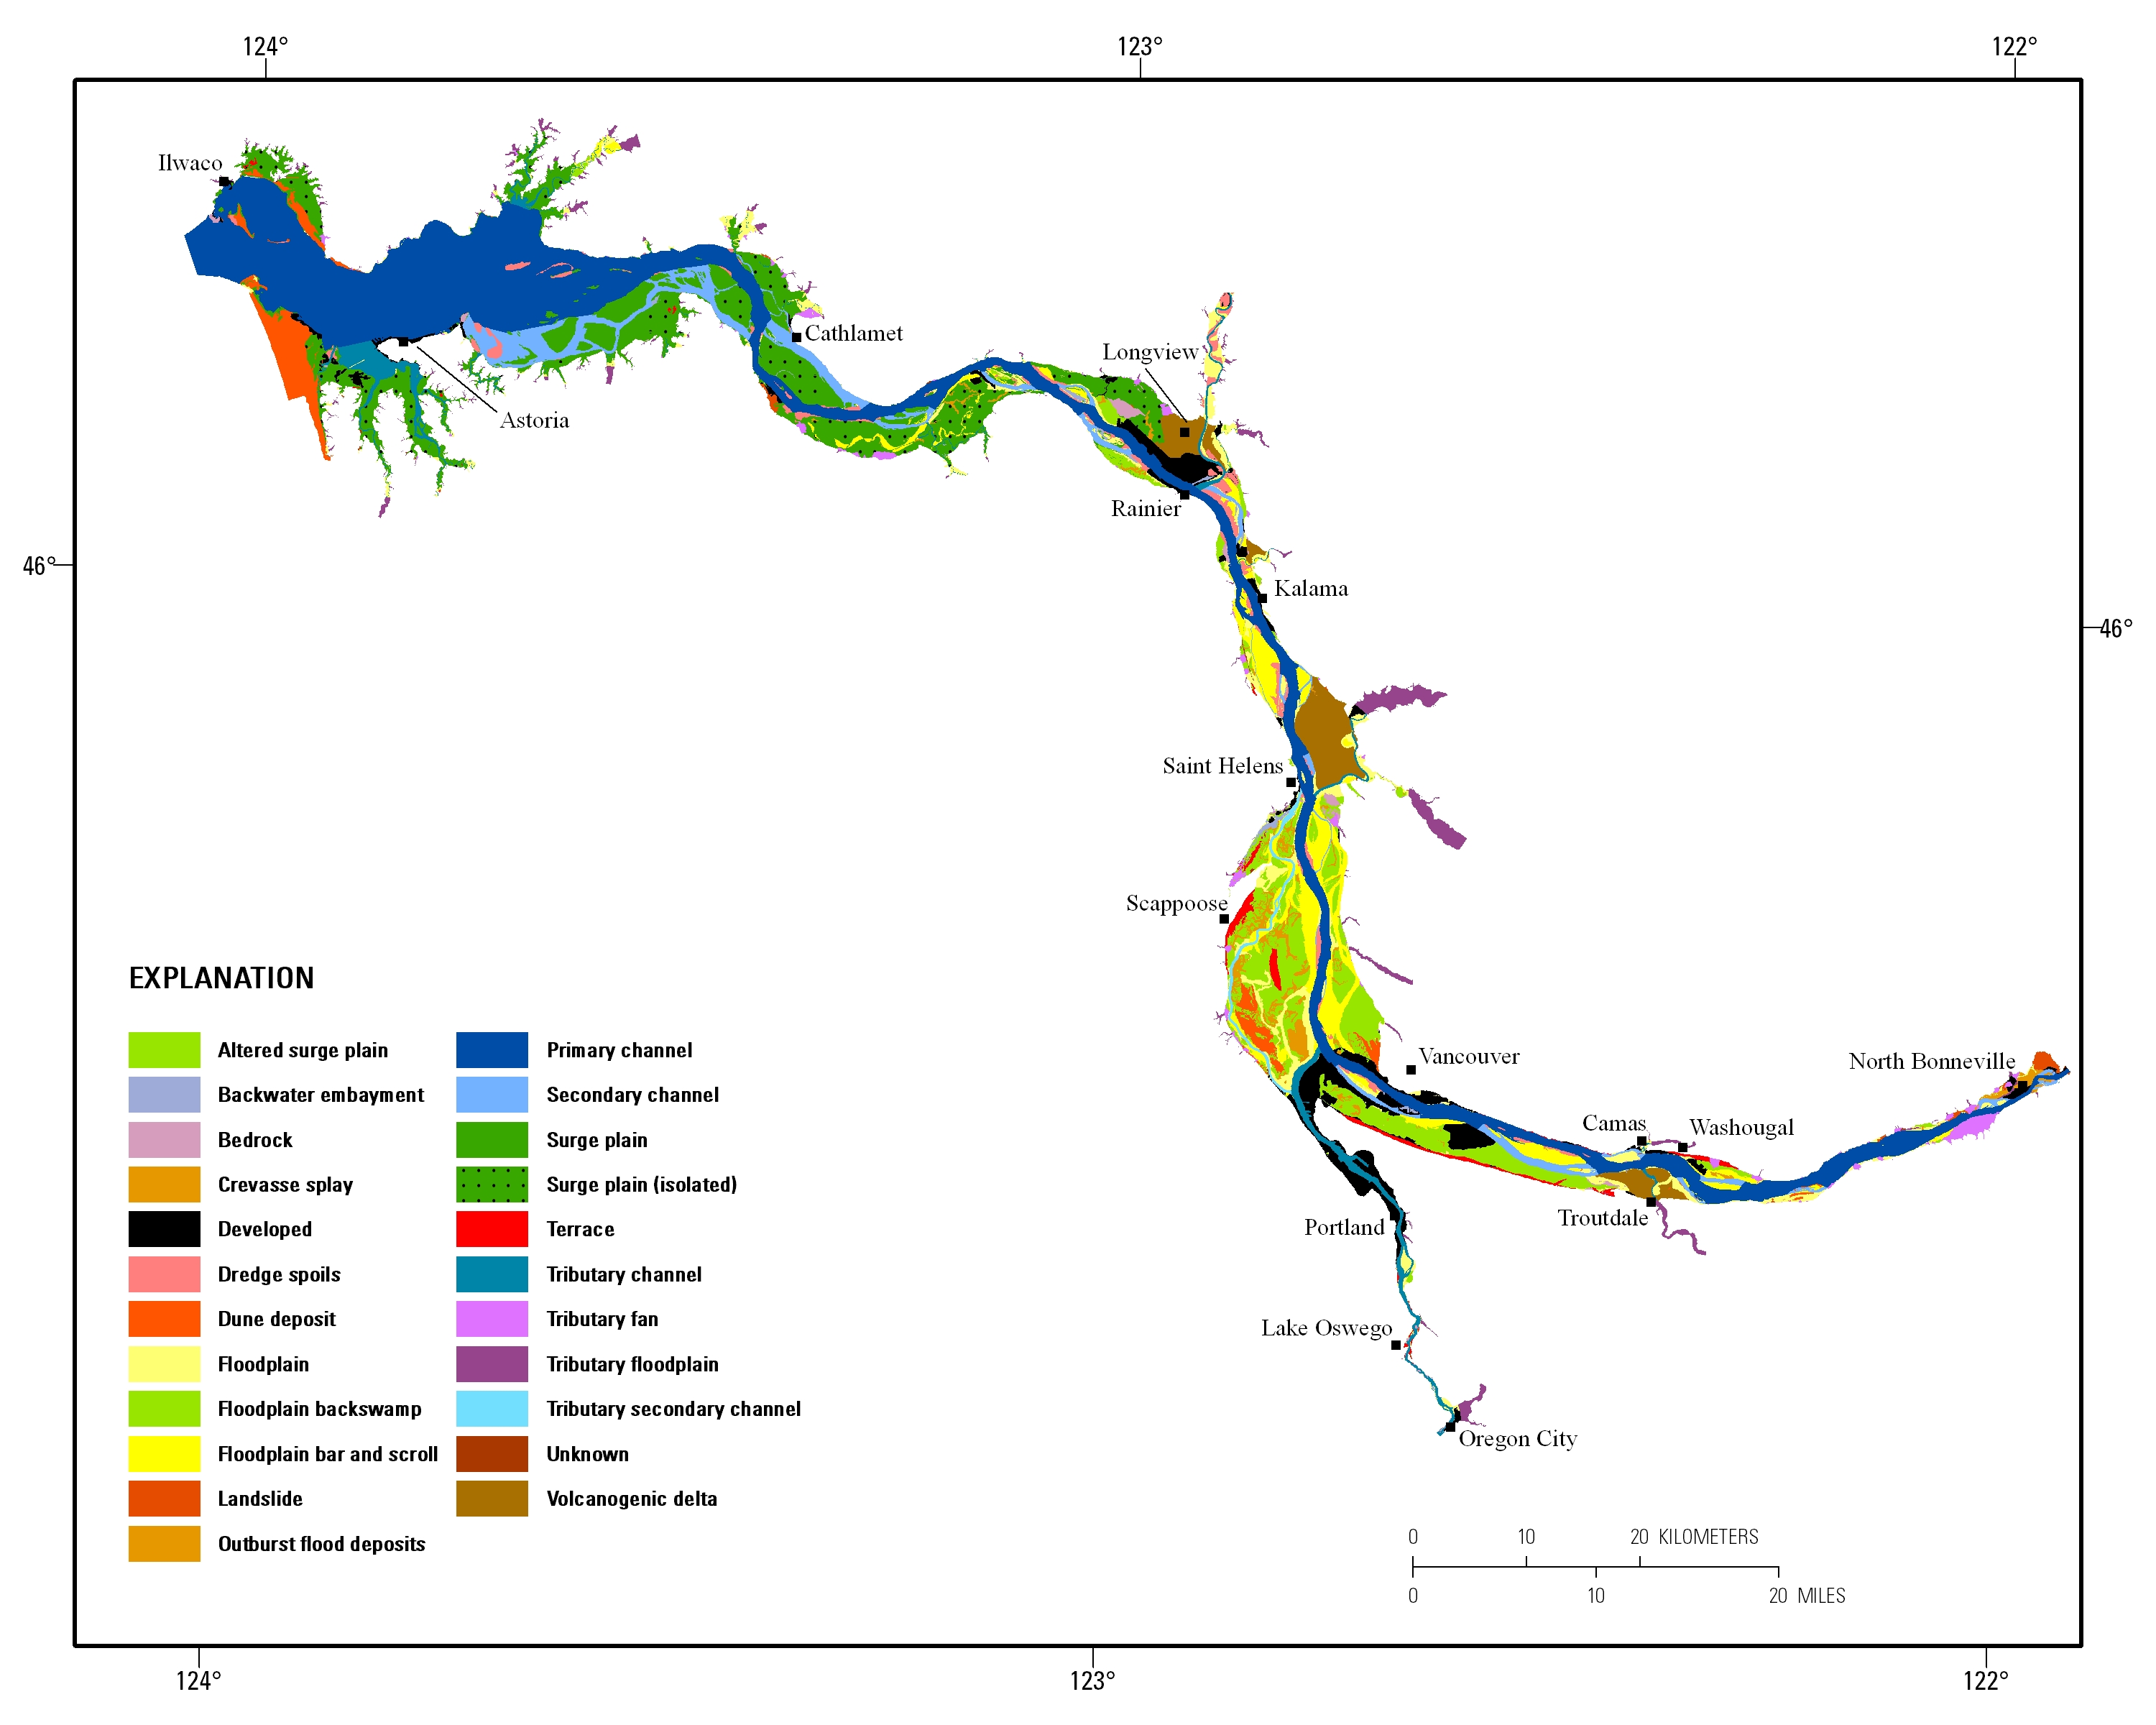
Estuarine ecosystems are controlled by a variety of processes that operate at multiple spatial and temporal scales. Understanding the hierarchical nature of these processes will aid in prioritization of restoration efforts. This hierarchical Columbia River Estuary Ecosystem Classification (henceforth "Classification") of the Columbia River estuary is a spatial database of the tidally-influenced reaches of the lower Columbia River, the tidally affected parts of its tributaries, and the landforms that make up their floodplains for the 230 kilometers between the Pacific Ocean and Bonneville Dam. This work is a collaborative effort between University of Washington School of Aquatic and Fishery Sciences (henceforth "UW"),...
Aquatic invasive species are often transported between water bodies on boats or boat trailers, thus they are considered one of the primary vectors for new introductions of invasive species to a water body. This data set contains geographic positioning system locational data for boater access points, use data (i.e. recreational, fishing), water quality measurements (e.g. calcium concentrations, pH), risk assessment data, and other physical attributes (i.e. size, elevation) where available within the Columbia and Snake Rivers and throughout the Columbia River Basin. This work builds on an earlier body of work by Wells et al. 2011, Prioritizing Zebra and Quagga Mussel Monitoring in the Columbia River Basin (PDF link...
Categories: Data,
Publication;
Types: ArcGIS REST Map Service,
ArcGIS Service Definition,
Citation,
Downloadable,
Map Service;
Tags: Boat ramps,
Columbia River,
Columbia River Basin,
Dreissenids,
USGS Science Data Catalog (SDC),
This portion of the USGS data release presents gridded bathymetry data derived from repeated bathymetric surveys conducted by the U.S. Army Corps of Engineers Portland District on the Pacific Ocean, Washington. Repeated surveys were performed between September 9, 2020 and March 10, 2021 from a vessel equipped with a multi-beam bathymetry system to characterize the morphology and dispersal of a nearshore berm composed of sediment dredged from the navigational channel at the mouth of the Columbia River. Digital data files containing gridded bathymetry data for each survey are provided in ESRI ARC ASCII (*.asc) format.
Categories: Data;
Tags: Bathymetry and Elevation,
CMHRP,
Coastal and Marine Hazards and Resources Program,
Columbia River,
GPS measurement,
|

|
