Filters: Tags: Comal County (X)
125 results (72ms)|
Filters
Date Range
Types Contacts
Categories Tag Types Tag Schemes |
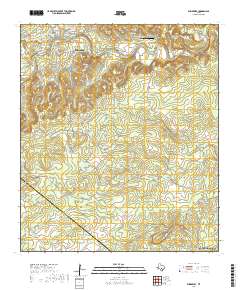
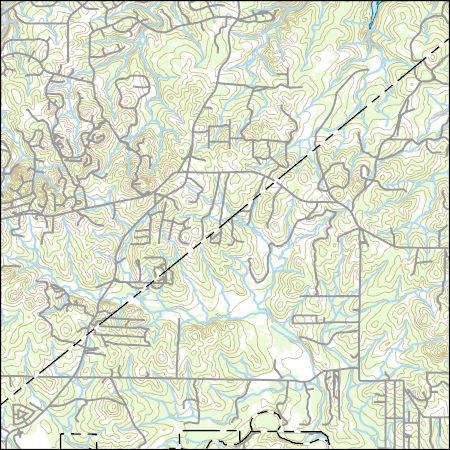
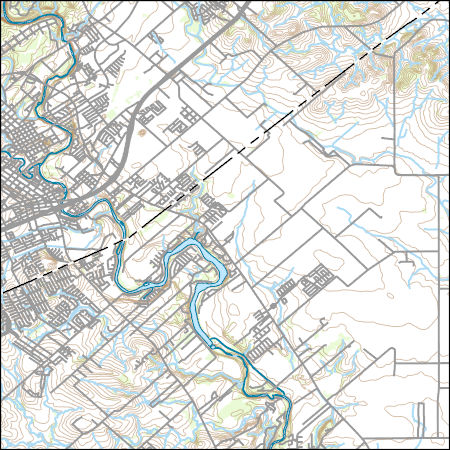
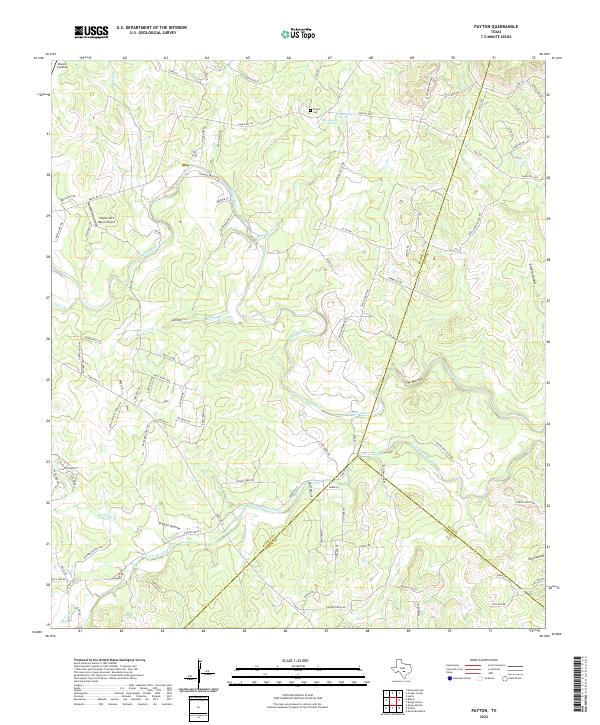
Layered geospatial PDF 7.5 Minute Quadrangle Map. Layers of geospatial data include orthoimagery, roads, grids, geographic names, elevation contours, hydrography, and other selected map features. This map is derived from GIS (geospatial information system) data. It represents a repackaging of GIS data in traditional map form, not creation of new information. The geospatial data in this map are from selected National Map data holdings and other government sources.
Layered geospatial PDF 7.5 Minute Quadrangle Map. Layers of geospatial data include orthoimagery, roads, grids, geographic names, elevation contours, hydrography, and other selected map features. This map is derived from GIS (geospatial information system) data. It represents a repackaging of GIS data in traditional map form, not creation of new information. The geospatial data in this map are from selected National Map data holdings and other government sources.
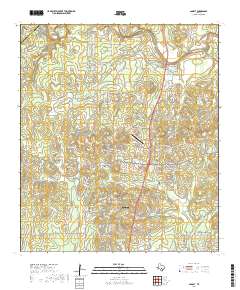
Layered geospatial PDF 7.5 Minute Quadrangle Map. Layers of geospatial data include orthoimagery, roads, grids, geographic names, elevation contours, hydrography, and other selected map features. This map is derived from GIS (geospatial information system) data. It represents a repackaging of GIS data in traditional map form, not creation of new information. The geospatial data in this map are from selected National Map data holdings and other government sources.

These vector contour lines are derived from the 3D Elevation Program using automated and semi-automated processes. They were created to support 1:24,000-scale CONUS and Hawaii, 1:25,000-scale Alaska, and 1:20,000-scale Puerto Rico / US Virgin Island topographic map products, but are also published in this GIS vector format. Contour intervals are assigned by 7.5-minute quadrangle, so this vector dataset is not visually seamless across quadrangle boundaries. The vector lines have elevation attributes (in feet above mean sea level on NAVD88), but this dataset does not carry line symbols or annotation.
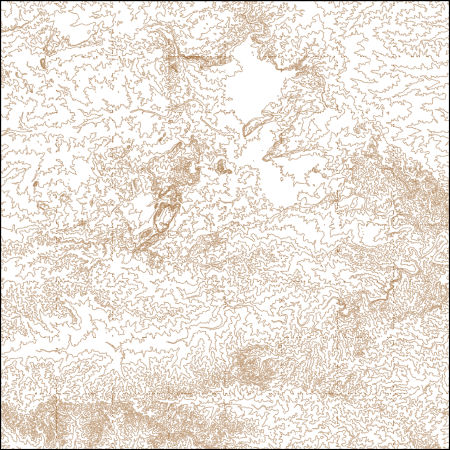
These vector contour lines are derived from the 3D Elevation Program using automated and semi-automated processes. They were created to support 1:24,000-scale CONUS and Hawaii, 1:25,000-scale Alaska, and 1:20,000-scale Puerto Rico / US Virgin Island topographic map products, but are also published in this GIS vector format. Contour intervals are assigned by 7.5-minute quadrangle, so this vector dataset is not visually seamless across quadrangle boundaries. The vector lines have elevation attributes (in feet above mean sea level on NAVD88), but this dataset does not carry line symbols or annotation.
Layers of geospatial data include contours, boundaries, land cover, hydrography, roads, transportation, geographic names, structures, and other selected map features.
Layers of geospatial data include contours, boundaries, land cover, hydrography, roads, transportation, geographic names, structures, and other selected map features.
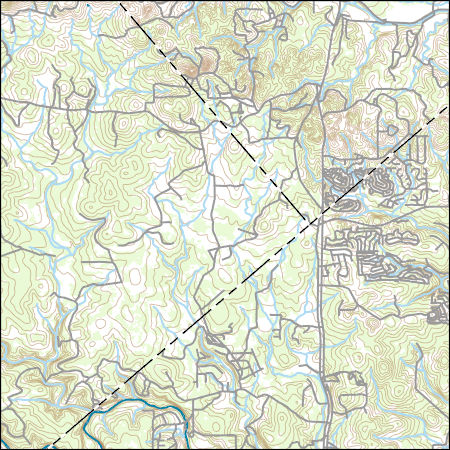
Layers of geospatial data include contours, boundaries, land cover, hydrography, roads, transportation, geographic names, structures, and other selected map features.
Layers of geospatial data include contours, boundaries, land cover, hydrography, roads, transportation, geographic names, structures, and other selected map features.
Layers of geospatial data include contours, boundaries, land cover, hydrography, roads, transportation, geographic names, structures, and other selected map features.
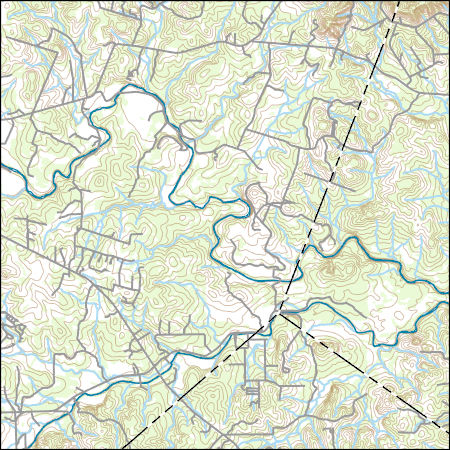
Layers of geospatial data include contours, boundaries, land cover, hydrography, roads, transportation, geographic names, structures, and other selected map features.
This data release documents water-quality data collected from April 2010 through December 2016 by the U.S. Geological Survey in cooperation with the San Antonio Water System from across the San Antonio segment of the Edwards aquifer with particular emphasis on nutrients and pesticides. Additional data regarding inorganic compounds and selected stable isotopes were obtained to provide a geochemical framework for characterizing source inputs and observed chemical changes during periods of hydrologic transition. Water-quality data were collected from surface-water and groundwater sites representing rural and urban land cover types. Data were obtained from unconfined wells in the recharge zone to characterize the rapid...
The extensive development of oil and natural-gas resources in south Texas during the past 10 years has led to questions regarding possible environmental effects of processes associated with oil and natural-gas production, in particular the process of hydraulic fracturing, on water and other natural resources. Part of the lower San Antonio River watershed intersects an area of oil and natural-gas production from the sedimentary rocks that compose the Eagle Ford Group. The rapid expansion of infrastructure associated with oil and natural-gas production increases potential pathways for inorganic and organic contaminants to enter surface-water systems. The U.S. Geological Survey, in cooperation with the San Antonio...
Types: Map Service,
OGC WFS Layer,
OGC WMS Layer,
OGC WMS Service;
Tags: Bexar County,
Cibolo Creek,
Comal County,
DeWitt County,
Ecleto Creek,
Located in south-central Texas, the Geronimo Creek and Plum Creek watersheds have long been characterized by elevated nitrate concentrations. From April 2015 through March 2016, an investigation was done by the U.S. Geological Survey, in cooperation with the Guadalupe-Blanco River Authority (GBRA) and the Texas State Soil and Water Conservation Board (TSSWCB), to assess nitrate (as nitrogen) concentrations and to document possible sources of elevated nitrate as nitrogen in these two watersheds. Water-quality samples were collected from 20 groundwater, spring, and stream sites across the two watersheds, along with precipitation samples and wastewater treatment plant (WWTP) effluent samples from the Plum Creek watershed....
The Edwards aquifer in south-central Texas is one of the most permeable and productive aquifers in the United States and is the major source of public water supply for Bexar, Comal, Hays, Medina, and Uvalde Counties. The Edwards aquifer also supplies large quantities of water to agriculture, business, and industry in the region. The major artesian springs of the Edwards aquifer provide water for recreational activities, businesses, and downstream users, and provide habitat for several threatened or endangered species. The areas pertinent to the recharge process are the catchment area and the recharge zone. The catchment area consists of the parts of river basins upstream from the recharge zone. Streams in the catchment...
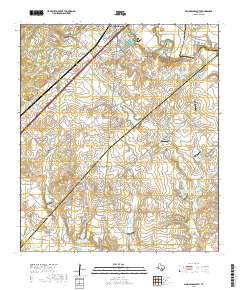
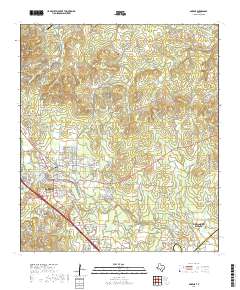
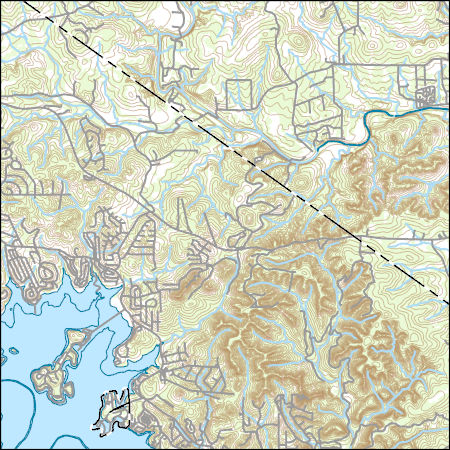
Layered geospatial PDF 7.5 Minute Quadrangle Map. Layers of geospatial data include orthoimagery, roads, grids, geographic names, elevation contours, hydrography, and other selected map features. This map is derived from GIS (geospatial information system) data. It represents a repackaging of GIS data in traditional map form, not creation of new information. The geospatial data in this map are from selected National Map data holdings and other government sources.

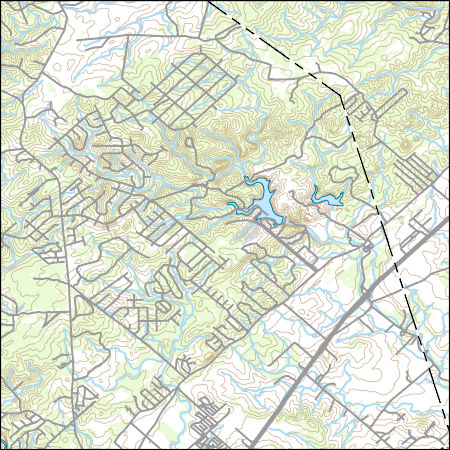
Layers of geospatial data include contours, boundaries, land cover, hydrography, roads, transportation, geographic names, structures, and other selected map features.

Layers of geospatial data include contours, boundaries, land cover, hydrography, roads, transportation, geographic names, structures, and other selected map features.
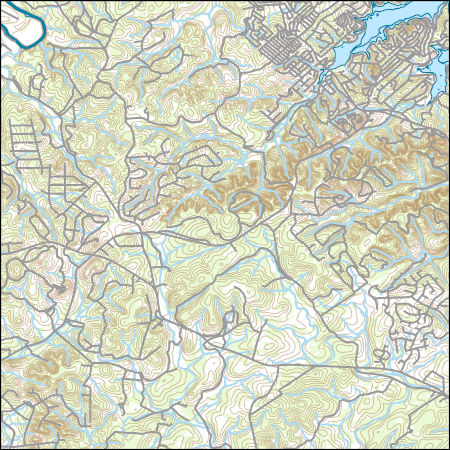
Layers of geospatial data include contours, boundaries, land cover, hydrography, roads, transportation, geographic names, structures, and other selected map features.
Layered geospatial PDF 7.5 Minute Quadrangle Map. Layers of geospatial data include orthoimagery, roads, grids, geographic names, elevation contours, hydrography, and other selected map features. This map is derived from GIS (geospatial information system) data. It represents a repackaging of GIS data in traditional map form, not creation of new information. The geospatial data in this map are from selected National Map data holdings and other government sources.
|

|
