Filters: Tags: Connecticut (X)
1,347 results (21ms)|
Filters
Date Range
Extensions
Types
Contacts
Categories Tag Types
|
Layers of geospatial data include contours, boundaries, land cover, hydrography, roads, transportation, geographic names, structures, and other selected map features.
This EnviroAtlas web service supports research and online mapping activities related to EnviroAtlas (https://www.epa.gov/enviroatlas). The Clean and Plentiful Water category in this web service includes layers illustrating the ecosystems and natural resources that filter and regulate water, the need or demand for clean and plentiful water, the impacts associated with water quality, and factors that place stress on water quality and supply. EnviroAtlas allows the user to interact with a web-based, easy-to-use, mapping application to view and analyze multiple ecosystem services for the conterminous United States. Additional descriptive information about each attribute in this web service is located within each web...
This child item describes Python code used to estimate average yearly and monthly tourism per 1000 residents within public-supply water service areas. Increases in population due to tourism may impact amounts of water used by public-supply water systems. This data release contains model input datasets, Python code used to develop the tourism information, and output estimates of tourism. This dataset is part of a larger data release using machine learning to predict public supply water use for 12-digit hydrologic units from 2000-2020. Output from this code was used as an input feature in the public supply delivery and water use machine learning models. This page includes the following files: tourism_input_data.zip...
This child item describes a public supply delivery machine learning model that was developed to estimate public-supply deliveries. Publicly supplied water may be delivered to domestic users or to commercial, industrial, institutional, and irrigation (CII) users. This model predicts total, domestic, and CII per capita rates for public-supply water service areas within the conterminous United States for 2009-2020. This child item contains model input datasets, code used to build the delivery machine learning model, and national predictions. This dataset is part of a larger data release using machine learning to predict public-supply water use for 12-digit hydrologic units from 2000-2020. This page includes the following...
This child item describes Python code used to query census data from the TigerWeb Representational State Transfer (REST) services and the U.S. Census Bureau Application Programming Interface (API). These data were needed as input feature variables for a machine learning model to predict public supply water use for the conterminous United States. Census data were retrieved for public-supply water service areas, but the census data collector could be used to retrieve data for other areas of interest. This dataset is part of a larger data release using machine learning to predict public supply water use for 12-digit hydrologic units from 2000-2020. Data retrieved by the census data collector code were used as input...
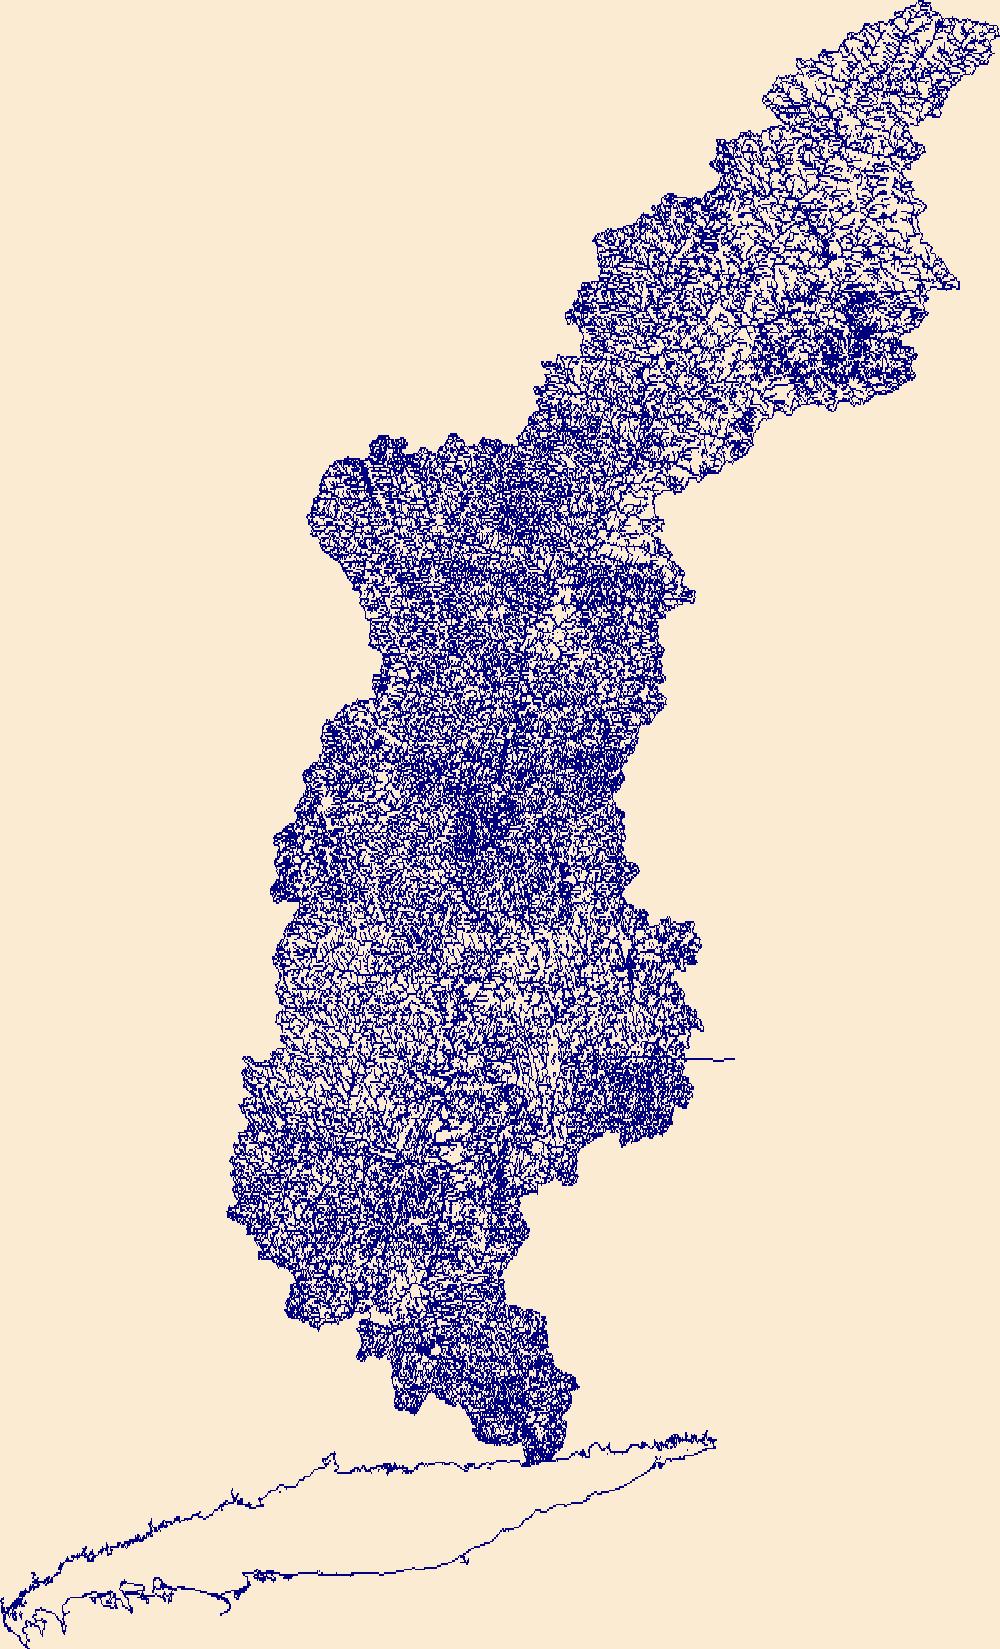
The High Resolution National Hydrography Dataset Plus (NHDPlus HR) is an integrated set of geospatial data layers, including the National Hydrography Dataset (NHD), National Watershed Boundary Dataset (WBD), and 3D Elevation Program Digital Elevation Model (3DEP DEM). The NHDPlus HR combines the NHD, 3DEP DEMs, and WBD to a data suite that includes the NHD stream network with linear referencing functionality, the WBD hydrologic units, elevation-derived catchment areas for each stream segment, "value added attributes" (VAAs), and other features that enhance hydrologic data analysis and routing.
This data release contains coastal wetland synthesis products for the state of Connecticut. Metrics for resiliency, including the unvegetated to vegetated ratio (UVVR), marsh elevation, tidal range, wave power, and exposure potential to environmental health stressors are calculated for smaller units delineated from a digital elevation model, providing the spatial variability of physical factors that influence wetland health. The U.S. Geological Survey has been expanding national assessment of coastal change hazards and forecast products to coastal wetlands with the intent of providing federal, state, and local managers with tools to estimate the vulnerability and ecosystem service potential of these wetlands. For...
This map layer shows major ports in the United States, Puerto Rico, and the U.S. Virgin Islands. A port is a city, town, or urban area with a harbor where ships load or unload. This is a revised version of the July 2012 map layer.
Categories: Data;
Types: Downloadable,
Map Service,
OGC WFS Layer,
OGC WMS Layer,
Shapefile;
Tags: Academics & scientific researchers,
Alabama,
Arizona,
Arkansas,
California,
This data set represents the extent, approximate location and type of wetlands and deepwater habitats in the United States and its Territories. These data delineate the areal extent of wetlands and surface waters as defined by Cowardin et al. (1979). Certain wetland habitats are excluded from the National mapping program because of the limitations of aerial imagery as the primary data source used to detect wetlands. These habitats include seagrasses or submerged aquatic vegetation that are found in the intertidal and subtidal zones of estuaries and near shore coastal waters. Some deepwater reef communities (coral or tuberficid worm reefs) have also been excluded from the inventory. These habitats, because of their...
Categories: Data;
Types: Map Service,
OGC WFS Layer,
OGC WMS Layer,
OGC WMS Service;
Tags: Academics & scientific researchers,
Alabama,
Alabama,
Alaska,
Arizona,
This data release contains input data used in model development and TIF raster files used to predict the probability of high arsenic (As) and high manganese (Mn) in groundwater within the glacial aquifer system in the northern United States. Input data include measured As and Mn concentrations at groundwater wells, and associated predictor variable data. The probability of high As and high Mn was predicted using boosted regression tree methods using the gbm package in R version 4.0.0. The response variables for individual models were the occurrence of: (1) As >10 µg/L, and (2) Mn >300 µg/L. Water-quality data were compiled from three sources, as described in Wilson and others (2019): a compilation of data from numerous...
This dataset represents the connections between each nearby pair of 2080 cores for American woodcock. It is intended to highlight areas important for connecting cores and to visually represent the connections among refugia cores.
Categories: Data;
Types: Downloadable,
GeoTIFF,
Map Service,
Raster;
Tags: Connecticut,
Delaware,
District of Columbia,
Maine,
Maryland,
This dataset represents the connections between each nearby pair of 2020 cores for Blackburnian warbler. It is intended to highlight areas important for connecting cores and to visually represent the connections among cores.
Categories: Data;
Types: Downloadable,
GeoTIFF,
Map Service,
Raster;
Tags: Connecticut,
Delaware,
District of Columbia,
Maine,
Maryland,
We used spatial data from previously mapped preferential groundwater discharges throughout the Farmington River watershed in Connecticut and Massachusetts (https://doi.org/10.5066/P915E8JY) to guide water sample collection at known locations of groundwater discharging to surface water. In 2017 and 2019 - 2021, samples were collected during general river baseflow conditions (July – November, <30.9 cms mean daily discharge (USGS gage 01189995, statistics 2010-2022) when the riverbank discharge points were exposed. We collected a suite of dissolved constituents and stable isotopes of water directly in the shallow saturated sediments of active points of discharge, and coincident stream chemical samples were also collected...
Categories: Data;
Types: Downloadable,
Map Service,
OGC WFS Layer,
OGC WMS Layer,
Shapefile;
Tags: Connecticut,
Farmington River,
Hydrology,
Massachusetts,
USGS Science Data Catalog (SDC),
Measures used to assess trends in the 10th, 50th, and 90th quantiles of annual peak streamflow from 1916-2015 at 2,683 U.S. Geological Survey stations and within 191 4-digit HUCs in the conterminous United States. Linear quantile regression was applied to the selected quantiles of log-transformed annual peak streamflow to represent trends for a range of flood frequencies from small, common floods to large, infrequent floods. Comparative trends in pairs of quantiles were characterized as coherent, convergent, or divergent by comparing the slopes of linear quantile regression equations.
Daily lake surface temperatures estimates for 185,549 lakes across the contiguous United States from 1980 to 2020 generated using an entity-aware long short-term memory deep learning model. In-situ measurements used for model training and evaluation are from 12,227 lakes and are included as well as daily meteorological conditions and lake properties. Median per-lake estimated error found through cross validation on lakes with in-situ surface temperature observations was 1.24 °C. The generated dataset will be beneficial for a wide range of applications including estimations of thermal habitats and the impacts of climate change on inland lakes.
This data release contains relevant datasets used in the analysis for the Chesapeake Bay stressor identification project, for which results are described in Fanelli and others (2022). For this project, two existing information sources were compiled and summarized to identify key in-stream stressors reported by the scientific literature or through regulatory assessments to be likely affecting benthic macroinvertebrate community metrics in the Chesapeake Bay region: 1) the peer reviewed multi-stressor literature, in which the effects multiple in-stream stressors on benthic macroinvertebrate community metrics are simultaneously assessed; and 2) reported causes of biological impairment as listed by state or district...
This data release includes 40Ar/39Ar data from the U.S. Geological Survey for samples from Old Mine Park Area, Trumbull, Connecticut. Mineral samples were collected by Robert Wintsch and Harold Moritz. Potassium-bearing mineral grains were separated from the bulk sample and analyzed by argon geochronology at the U.S. Geological Survey Bascom ARgon Dating (BARD) Laboratory in Reston, Virginia. The data provide age constraints on units in the relevant geologic mapping area.
Categories: Data;
Tags: 40Ar/39Ar,
Bascom ARgon Dating Laboratory,
Connecticut,
Economic Geology,
FBGC,
Areas of groundwater discharge are hydrologically and ecologically important, and yet are difficult to predict at the river network scale. Thermal infrared imagery can be used to identify areas of groundwater discharge based on an observed temperature anomaly (colder during the late summer or warmer during the late winter). The thermal images, direct temperature measurements (11 cm depth) and discharge zone (seep) location information in this data release were collected as part of a study to evaluate and improve predicted spatial patterns of groundwater discharge. The data were collected during the late summer / early fall of 2017 along selected river reaches in the Farmington River watershed (Connecticut and Massachusetts)....
Categories: Data;
Types: Downloadable,
Map Service,
OGC WFS Layer,
OGC WMS Layer,
Shapefile;
Tags: Connecticut,
Farmington River,
Groundwater,
Hydrology,
Massachusetts,
This dataset presents the total estimated monthly public-supply water withdrawal by 12-digit hydrologic unit code (HUC12) in the conterminous United States for 2015. Public-supply water use was estimated by spatially and temporally downscaling available data from each state. The total represents combined groundwater and surface water withdrawals for 83,178 watersheds. Public supply refers to water withdrawn by public and private water suppliers that provide water for cities, towns, rural water districts, mobile-home parks, Native American Indian reservations, and military bases. Public-supply facilities are classified under the Standard Industrial Classification (SIC) 4941 and provide water to at least 25 people...
This dataset represents public and non-governmental organizations (NGO) beaches in the North and Mid-Atlantic. The data are part of a larger project, Inventory of Habitat Modifications to Sandy Oceanfront Beaches in the U.S. Atlantic Coast Breeding Range of the Piping Plover (Charadrius melodus) as of 2015: Maine to North Carolina. Beachfront land parcels in public or NGO ownership were delineated from a variety of sources, including county or municipal parcel data available online to the public (see Table 1 of Rice 2015b for a full list of sources consulted for Maine to New York). Public and NGO-owned beachfront parcels are delineated with narrow, lime green lines in Google Earth Pro. The public / NGO line segments...
Categories: Data;
Types: ArcGIS REST Map Service,
ArcGIS Service Definition,
Downloadable,
Map Service;
Tags: Connecticut,
Delaware,
Long Island Sound,
Maine,
Maryland,
|

|
