Filters: Tags: Cook County (X) > partyWithName: U.S. Geological Survey (X)
429 results (279ms)|
Filters
Date Range
Types Contacts
Categories Tag Types Tag Schemes |
Layers of geospatial data include contours, boundaries, land cover, hydrography, roads, transportation, geographic names, structures, and other selected map features.
Types: Citation;
Tags: 7.5 x 7.5 minute,
7.5 x 7.5 minute,
Combined Vector,
Combined Vector,
Combined Vector,
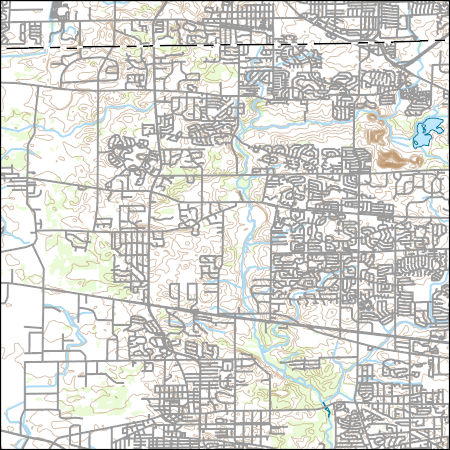
USGS Topo Map Vector Data (Vector) 2488 Barrington, Illinois 20210628 for 7.5 x 7.5 minute Shapefile
Layers of geospatial data include contours, boundaries, land cover, hydrography, roads, transportation, geographic names, structures, and other selected map features.
Types: Citation;
Tags: 7.5 x 7.5 minute,
7.5 x 7.5 minute,
Combined Vector,
Combined Vector,
Combined Vector,
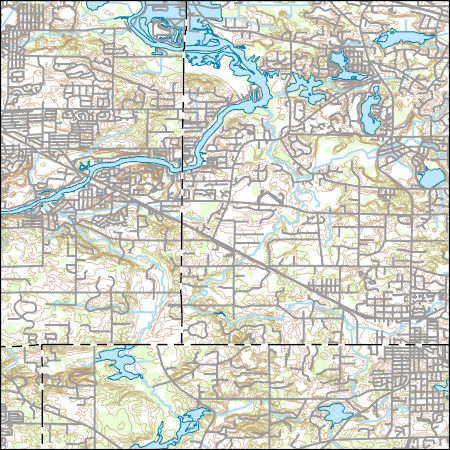
Layers of geospatial data include contours, boundaries, land cover, hydrography, roads, transportation, geographic names, structures, and other selected map features.
Types: Citation;
Tags: 7.5 x 7.5 minute,
7.5 x 7.5 minute,
Combined Vector,
Combined Vector,
Combined Vector,
Layers of geospatial data include contours, boundaries, land cover, hydrography, roads, transportation, geographic names, structures, and other selected map features.
Layers of geospatial data include contours, boundaries, land cover, hydrography, roads, transportation, geographic names, structures, and other selected map features.
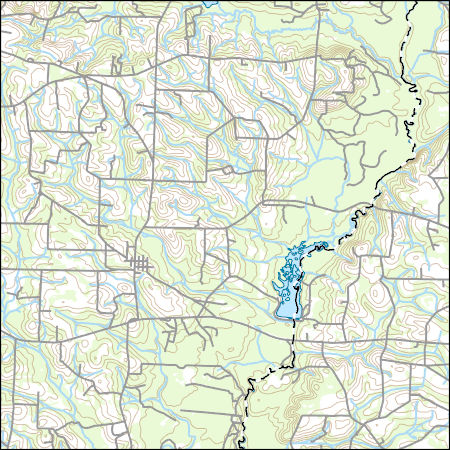
Layers of geospatial data include contours, boundaries, land cover, hydrography, roads, transportation, geographic names, structures, and other selected map features.
The table contains oxide and cation compositions of olivine grains from drill core of the Duluth Complex, Minnesota. The oxides were determined by electron probe microanalysis (EPMA) and are reported in weight percent (wt%). The cations were calculated based on the oxide compositions and are reported in mole percent (mol%). Olivine is a magnesium iron orthosilicate mineral with the formula (Mg2+, Fe2+)2SiO4. Olivine forms a solid solution series with magnesium (Mg) at one end and iron (Fe) at the other. Forsterite (Mg2SiO4) is the magnesium endmember and fayalite (Fe2SiO4) is the iron endmember. Minor elements can substitute into the crystal structure, such as manganese (Mn) and nickel (Ni). To better understand...
Categories: Data;
Types: Citation;
Tags: Cook County,
Duluth,
Environmental Health,
Geochemistry,
Lake County,
This dataset provides a subset of well construction information provided by the driller's well logs. Complete well logs can be accessed on the Minnesota Well Index online (http://www.health.state.mn.us/ divs/eh/cwi/).
Categories: Data;
Tags: Anoka County,
Becker County,
Beltrami County,
Carlton County,
Carver County,
This dataset provides aqueous nitrate+nitrite, aqueous manganese, aqueous iron, and total sulfate measurements in groundwater samples from 254 newly constructed private residential wells between 2014 and 2016. The study focuses on three geologically distinct regions of Minnesota: central, northwest, and northeast. These study regions were chosen due to their prevalent elevated As concentrations in drinking water. Each of the 254 wells were sampled in three rounds by the Minnesota Department of Health (MDH). The timing of the three sampling rounds was (1) immediately or shortly after well construction (round 1); (2) 3-6 months after initial sample collection (round 2); and (3) 12 months after initial sample collection...
Categories: Data;
Tags: Anoka County,
Becker County,
Beltrami County,
Carlton County,
Carver County,
Layered geospatial PDF 7.5 Minute Quadrangle Map. Layers of geospatial data include orthoimagery, roads, grids, geographic names, elevation contours, hydrography, and other selected map features. This map is derived from GIS (geospatial information system) data. It represents a repackaging of GIS data in traditional map form, not creation of new information. The geospatial data in this map are from selected National Map data holdings and other government sources.
Layered geospatial PDF 7.5 Minute Quadrangle Map. Layers of geospatial data include orthoimagery, roads, grids, geographic names, elevation contours, hydrography, and other selected map features. This map is derived from GIS (geospatial information system) data. It represents a repackaging of GIS data in traditional map form, not creation of new information. The geospatial data in this map are from selected National Map data holdings and other government sources.

Layered geospatial PDF 7.5 Minute Quadrangle Map. Layers of geospatial data include orthoimagery, roads, grids, geographic names, elevation contours, hydrography, and other selected map features. This map is derived from GIS (geospatial information system) data. It represents a repackaging of GIS data in traditional map form, not creation of new information. The geospatial data in this map are from selected National Map data holdings and other government sources.
Layered geospatial PDF 7.5 Minute Quadrangle Map. Layers of geospatial data include orthoimagery, roads, grids, geographic names, elevation contours, hydrography, and other selected map features. This map is derived from GIS (geospatial information system) data. It represents a repackaging of GIS data in traditional map form, not creation of new information. The geospatial data in this map are from selected National Map data holdings and other government sources.
Layered geospatial PDF 7.5 Minute Quadrangle Map. Layers of geospatial data include orthoimagery, roads, grids, geographic names, elevation contours, hydrography, and other selected map features. This map is derived from GIS (geospatial information system) data. It represents a repackaging of GIS data in traditional map form, not creation of new information. The geospatial data in this map are from selected National Map data holdings and other government sources.
Layered geospatial PDF 7.5 Minute Quadrangle Map. Layers of geospatial data include orthoimagery, roads, grids, geographic names, elevation contours, hydrography, and other selected map features. This map is derived from GIS (geospatial information system) data. It represents a repackaging of GIS data in traditional map form, not creation of new information. The geospatial data in this map are from selected National Map data holdings and other government sources.
Layered geospatial PDF 7.5 Minute Quadrangle Map. Layers of geospatial data include orthoimagery, roads, grids, geographic names, elevation contours, hydrography, and other selected map features. This map is derived from GIS (geospatial information system) data. It represents a repackaging of GIS data in traditional map form, not creation of new information. The geospatial data in this map are from selected National Map data holdings and other government sources.
Layered geospatial PDF 7.5 Minute Quadrangle Map. Layers of geospatial data include orthoimagery, roads, grids, geographic names, elevation contours, hydrography, and other selected map features. This map is derived from GIS (geospatial information system) data. It represents a repackaging of GIS data in traditional map form, not creation of new information. The geospatial data in this map are from selected National Map data holdings and other government sources.
Layered geospatial PDF 7.5 Minute Quadrangle Map. Layers of geospatial data include orthoimagery, roads, grids, geographic names, elevation contours, hydrography, and other selected map features. This map is derived from GIS (geospatial information system) data. It represents a repackaging of GIS data in traditional map form, not creation of new information. The geospatial data in this map are from selected National Map data holdings and other government sources.
These data were collected using a 1200 kHz TRDI Rio Grande acoustic Doppler current profiler (ADCP) in mode 12 with 25 centimeter bins from a moving boat. The data were georeferenced with a Hemisphere Crescent A100 differential Global Positioning System (GPS) receiver with submeter accuracy. The data have been depth-averaged over the entire measured portion of the water column and temporally averaged over 5-second intervals to reduce noise. These data were collected by the U.S. Geological Survey (USGS) concurrently with environmental DNA (eDNA) sampling in this reach of the Chicago Sanitary and Ship Canal (CSSC) by the U.S. Fish and Wildlife Service (USFWS). Data were processed using the Velocity Mapping Toolbox...
Categories: Data;
Types: Citation,
Map Service,
OGC WFS Layer,
OGC WMS Layer,
OGC WMS Service;
Tags: Chicago Sanitary and Ship Canal,
Cook County,
DuPage County,
Illinois,
Velocity,
These data were collected using a 1200 kHz TRDI Rio Grande acoustic Doppler current profiler (ADCP) in mode 12 with 25 centimeter bins from a moving boat. The data were georeferenced with a Hemisphere Crescent A100 differential Global Positioning System (GPS) receiver with submeter accuracy. The data have been layer-averaged over the lower portion of the water column (0 to 4 meters above the bed). These data were collected by the U.S. Geological Survey (USGS) concurrently with environmental DNA (eDNA) sampling in this reach of the Chicago Sanitary and Ship Canal by the U.S. Fish and Wildlife Service (USFWS). Data were processed using the Velocity Mapping Toolbox (Parsons and others, 2013). NOTE: Any data assigned...
Categories: Data;
Types: Citation,
Map Service,
OGC WFS Layer,
OGC WMS Layer,
OGC WMS Service;
Tags: Chicago Sanitary and Ship Canal,
Cook County,
Illinois,
Velocity
|

|
