Filters: Tags: Cortland County (X)
54 results (56ms)|
Filters
Date Range
Extensions Types
Contacts
Categories Tag Types
|
This dataset includes well logs used in the creation of the Cortland hydrogeologic framework. Well logs were used from multiple sources (DEC, DOT, NWIS) and were a crucial component in generating hydrogeologic layer elevations and thicknesses. Well logs are available in their original form on GeoLog Locator (https://webapps.usgs.gov/GeoLogLocator/#!/) and provided here in the digitized form (shapefiles and feature classes), which were used in the generation of the hydrogeologic framework.
Layered geospatial PDF 7.5 Minute Quadrangle Map. Layers of geospatial data include orthoimagery, roads, grids, geographic names, elevation contours, hydrography, and other selected map features. This map is derived from GIS (geospatial information system) data. It represents a repackaging of GIS data in traditional map form, not creation of new information. The geospatial data in this map are from selected National Map data holdings and other government sources.
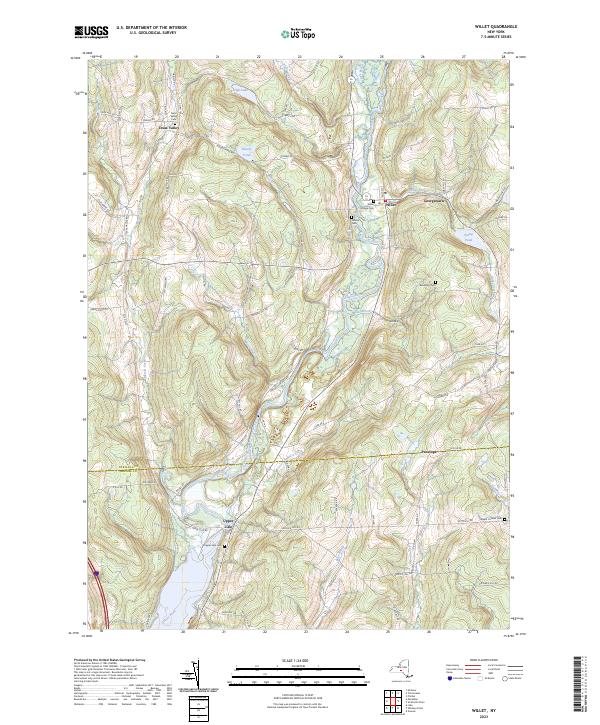
Layered geospatial PDF 7.5 Minute Quadrangle Map. Layers of geospatial data include orthoimagery, roads, grids, geographic names, elevation contours, hydrography, and other selected map features. This map is derived from GIS (geospatial information system) data. It represents a repackaging of GIS data in traditional map form, not creation of new information. The geospatial data in this map are from selected National Map data holdings and other government sources.
Layered geospatial PDF 7.5 Minute Quadrangle Map. Layers of geospatial data include orthoimagery, roads, grids, geographic names, elevation contours, hydrography, and other selected map features. This map is derived from GIS (geospatial information system) data. It represents a repackaging of GIS data in traditional map form, not creation of new information. The geospatial data in this map are from selected National Map data holdings and other government sources.
This folder contains water-level recovery data for selected hydraulic tests that support USGS Scientific Investigations Report 2020-5087, "Transmissivity Estimated from Brief Pumping Tests of Domestic Wells and Compared with Bedrock Lithofacies and Position on Hillsides in the Appalachian Plateau of New York." These data are part of a data release that contains observed water-level recovery data in 52 wells, matched to theoretical type curves defined by postulated values of aquifer transmissivity and storage, that together constitute the database for USGS Scientific Investigations Report 2020-5087. The water-level recovery data were collected after 13 to 132 seconds of pumping. Five of the wells were also test-pumped...
Layered geospatial PDF 7.5 Minute Quadrangle Map. Layers of geospatial data include orthoimagery, roads, grids, geographic names, elevation contours, hydrography, and other selected map features. This map is derived from GIS (geospatial information system) data. It represents a repackaging of GIS data in traditional map form, not creation of new information. The geospatial data in this map are from selected National Map data holdings and other government sources.
Layered geospatial PDF 7.5 Minute Quadrangle Map. Layers of geospatial data include orthoimagery, roads, grids, geographic names, elevation contours, hydrography, and other selected map features. This map is derived from GIS (geospatial information system) data. It represents a repackaging of GIS data in traditional map form, not creation of new information. The geospatial data in this map are from selected National Map data holdings and other government sources.
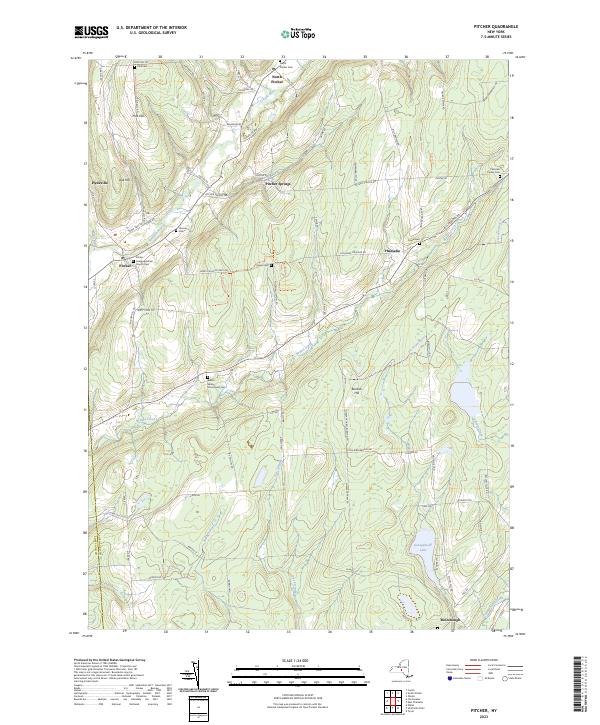
Layered geospatial PDF 7.5 Minute Quadrangle Map. Layers of geospatial data include orthoimagery, roads, grids, geographic names, elevation contours, hydrography, and other selected map features. This map is derived from GIS (geospatial information system) data. It represents a repackaging of GIS data in traditional map form, not creation of new information. The geospatial data in this map are from selected National Map data holdings and other government sources.

In the Chenango River Basin, New York, glacial valley-fill unconfined and confined aquifers are an important source of drinking-water supplies. The U.S. Geological Survey developed three-dimensional groundwater-flow models (MODFLOW-NWT code) of three study areas in the basin to improve understanding of groundwater flow and delineate areas contributing recharge to 16 production wells as part of an effort to protect the source of water to these wells. The modeled areas were the Cortland study area in Cortland County (CCSA), Greene study area (GSA), and the Cincinnatus study area (CSA). Production wells in CCSA tap unconfined aquifers, whereas the production wells in GSA and CSA are screened in confined aquifers. The...
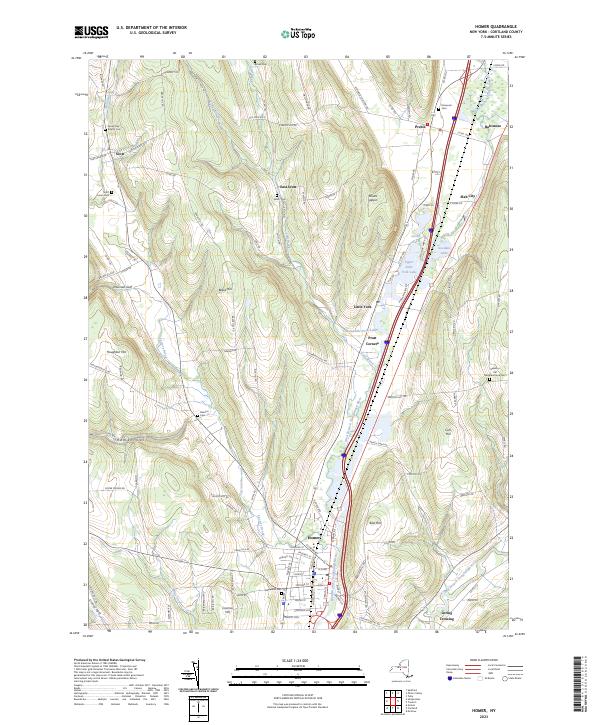
Layered geospatial PDF 7.5 Minute Quadrangle Map. Layers of geospatial data include orthoimagery, roads, grids, geographic names, elevation contours, hydrography, and other selected map features. This map is derived from GIS (geospatial information system) data. It represents a repackaging of GIS data in traditional map form, not creation of new information. The geospatial data in this map are from selected National Map data holdings and other government sources.
Layered geospatial PDF 7.5 Minute Quadrangle Map. Layers of geospatial data include orthoimagery, roads, grids, geographic names, elevation contours, hydrography, and other selected map features. This map is derived from GIS (geospatial information system) data. It represents a repackaging of GIS data in traditional map form, not creation of new information. The geospatial data in this map are from selected National Map data holdings and other government sources.
Problem - The Ithaca Subdistrict Office of the U.S. Geological Survey (USGS) is providing technical assistance to the USGS, Biological Resources Division (BRD), at the Tunison Laboratory of Aquatic Science (TLAS) in an investigation of the availability of fresh ground water. An expansion in the water supply at the laboratory is needed for a proposed spawning facility for salmon strains that are viable for natural fisheries in the Great Lakes region. The hydrogeology of the area is a complex of moraine and outwash deposits west of Cortland, N.Y. Data from existing wells at the laboratory indicate that well screens may readily clog from precipitated minerals. A review of the hydrogeology of the area, including...
Categories: Data,
Project;
Types: Downloadable,
Map Service,
OGC WFS Layer,
OGC WMS Layer,
Shapefile;
Tags: Borehole Geophysics,
Completed,
Cortland County,
Fisheries,
GW or SW,
This dataset includes georeferenced tiff files from two separate reports for the Cortland study area that have been digitized into feature classes within ArcGIS. Not all digitized and georeferenced data was necessarily used in the final interpolations, however they may have contributed to understanding the local hydrogeology
Layered geospatial PDF 7.5 Minute Quadrangle Map. Layers of geospatial data include orthoimagery, roads, grids, geographic names, elevation contours, hydrography, and other selected map features. This map is derived from GIS (geospatial information system) data. It represents a repackaging of GIS data in traditional map form, not creation of new information. The geospatial data in this map are from selected National Map data holdings and other government sources.
Layered geospatial PDF 7.5 Minute Quadrangle Map. Layers of geospatial data include orthoimagery, roads, grids, geographic names, elevation contours, hydrography, and other selected map features. This map is derived from GIS (geospatial information system) data. It represents a repackaging of GIS data in traditional map form, not creation of new information. The geospatial data in this map are from selected National Map data holdings and other government sources.
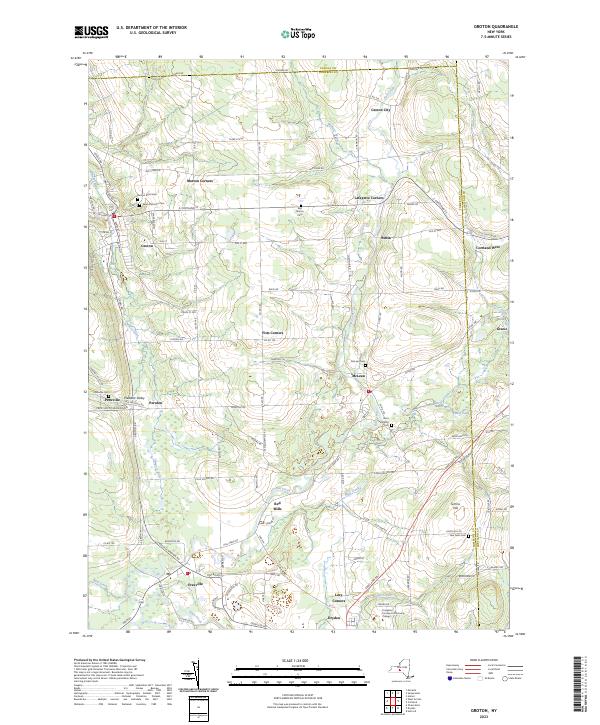
Layered geospatial PDF 7.5 Minute Quadrangle Map. Layers of geospatial data include orthoimagery, roads, grids, geographic names, elevation contours, hydrography, and other selected map features. This map is derived from GIS (geospatial information system) data. It represents a repackaging of GIS data in traditional map form, not creation of new information. The geospatial data in this map are from selected National Map data holdings and other government sources.
This folder contains analytical type-curve matches for selected hydraulic tests that support USGS Scientific Investigations Report 2020-5087, "Transmissivity Estimated from Brief Pumping Tests of Domestic Wells and Compared with Bedrock Lithofacies and Position on Hillsides in the Appalachian Plateau of New York." These data are part of a data release that contains observed water-level recovery data in 52 wells, matched to theoretical type curves defined by postulated values of aquifer transmissivity and storage, that together constitute the database for USGS Scientific Investigations Report 2020-5087. The water-level recovery data were collected after 13 to 132 seconds of pumping. Five of the wells were also...
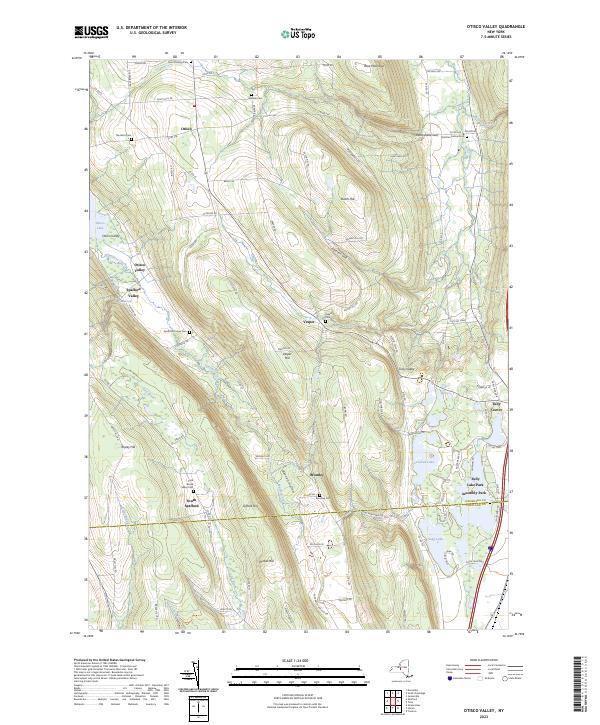
Layered geospatial PDF 7.5 Minute Quadrangle Map. Layers of geospatial data include orthoimagery, roads, grids, geographic names, elevation contours, hydrography, and other selected map features. This map is derived from GIS (geospatial information system) data. It represents a repackaging of GIS data in traditional map form, not creation of new information. The geospatial data in this map are from selected National Map data holdings and other government sources.
Layered geospatial PDF 7.5 Minute Quadrangle Map. Layers of geospatial data include orthoimagery, roads, grids, geographic names, elevation contours, hydrography, and other selected map features. This map is derived from GIS (geospatial information system) data. It represents a repackaging of GIS data in traditional map form, not creation of new information. The geospatial data in this map are from selected National Map data holdings and other government sources.
Cisco and Bloater growth data from hatchery reared fish were collected in association with a project to repopulate Lake Ontario native prey species. Fish were grown and measured under hatchery conditions for up to nine months before being released into Lake Ontario. Weekly measurements of total length, total weight, and morphometrics were recorded for both species to determine growth during their first year of growth for eight separate year-classes, 2012-2019.
|

|
