Filters: Tags: Corvallis (X)
33 results (15ms)|
Filters
Contacts
(Less)
|
Water-surface elevation measurements were collected in Spring, 2015 along the upper Willamette River, Oregon, between Harrisburg and Corvallis. These surveys were collected over a small range of discharges, from 6,900 cubic feet per second to 8,300 cubic feet per second, using a real-time kinematic global positioning system (RTK-GPS) on a motorboat at various cross sections along the river. These datasets were collected for equipment calibration and validation for the National Aeronautics and Space Administration’s (NASA) Surface Water and Ocean Topography (SWOT) satellite mission. This is one of multiple survey datasets that will be released for this effort.
Water-surface elevations were recorded by submerged pressure transducers in Spring, 2015 along the upper Willamette River, Oregon, between Eugene and Corvallis. The water-surface elevations were surveyed by using a real-time kinematic global positioning system (RTK-GPS) at each pressure sensor location. These water-surface elevations were logged over a small range of discharges, from 4,600 cubic feet per second to 10,800 cubic feet per second at Harrisburg, OR. These datasets were collected for equipment calibration and validation for the National Aeronautics and Space Administration’s (NASA) Surface Water and Ocean Topography (SWOT) satellite mission. This is one of multiple datasets that will be released for this...
This data set contains imagery from the National Agriculture Imagery Program (NAIP). The NAIP program is administered by USDA FSA and has been established to support two main FSA strategic goals centered on agricultural production. These are, increase stewardship of America's natural resources while enhancing the environment, and to ensure commodities are procured and distributed effectively and efficiently to increase food security. The NAIP program supports these goals by acquiring and providing ortho imagery that has been collected during the agricultural growing season in the U.S. The NAIP ortho imagery is tailored to meet FSA requirements and is a fundamental tool used to support FSA farm and conservation programs....
River bathymetry and stream velocity measurements were collected in March 2015 along the upper Willamette River, Oregon, between Eugene and Corvallis. These surveys were collected over a small range of discharges using a real time kinematic global positioning system (RTK-GPS) and acoustic Doppler current profiler (ADCP) on a motorboat while transecting at various cross sections along the river. These datasets were collected for equipment calibration and validation for the National Aeronautics and Space Administration’s (NASA) Surface Water and Ocean Topography (SWOT) satellite mission. This is one of multiple survey datasets that will be released for this effort.
This data set contains imagery from the National Agriculture Imagery Program (NAIP). The NAIP program is administered by USDA FSA and has been established to support two main FSA strategic goals centered on agricultural production. These are, increase stewardship of America's natural resources while enhancing the environment, and to ensure commodities are procured and distributed effectively and efficiently to increase food security. The NAIP program supports these goals by acquiring and providing ortho imagery that has been collected during the agricultural growing season in the U.S. The NAIP ortho imagery is tailored to meet FSA requirements and is a fundamental tool used to support FSA farm and conservation programs....
This dataset contains two-dimensional hydraulic models throughout the Willamette River, extending from the McKenzie River confluence, near Eugene, to the city of Newberg. The study reach is separated into five individual models to simplify tributary inflow boundary conditions and for run-time efficiency. These models were developed to assess juvenile salmonid habitat at streamflows ranging from typical low summer flows to roughly the median annual high flow along each reach. Steady-state streamflow conditions were simulated in an unsteady flow simulation by holding streamflow constant for longer periods of time. Underlying these models is a digital elevation model, which combines bathymetric lidar, collected in...
Categories: Data;
Types: Downloadable,
GeoTIFF,
Map Service,
Raster;
Tags: Albany,
Bathymetry,
Corvallis,
HEC-RAS,
Harrisburg,
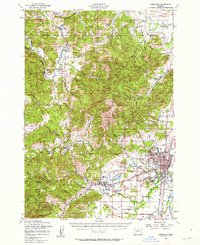
USGS Historical Quadrangle in GeoPDF.
This data set contains imagery from the National Agriculture Imagery Program (NAIP). The NAIP program is administered by USDA FSA and has been established to support two main FSA strategic goals centered on agricultural production. These are, increase stewardship of America's natural resources while enhancing the environment, and to ensure commodities are procured and distributed effectively and efficiently to increase food security. The NAIP program supports these goals by acquiring and providing ortho imagery that has been collected during the agricultural growing season in the U.S. The NAIP ortho imagery is tailored to meet FSA requirements and is a fundamental tool used to support FSA farm and conservation programs....
Water-surface elevation measurements were collected in March 2015 along the upper Willamette River, Oregon, between Eugene to Corvallis. These surveys were collected over a small range of discharges using a real time kinematic global positioning system (RTK-GPS) on a motorboat traveling "on plane" along the river. These datasets were collected for equipment calibration and validation for the National Aeronautics and Space Administration’s (NASA) Surface Water and Ocean Topography (SWOT) satellite mission. This is one of multiple survey datasets that will be released for this effort.
Categories: Data;
Types: Citation,
Downloadable,
Map Service,
OGC WFS Layer,
OGC WMS Layer,
Shapefile;
Tags: AirSWOT,
Corvallis,
Eugene,
Oregon,
RTK,
USGS Historical Quadrangle in GeoPDF.
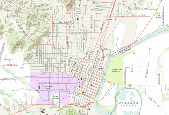
USGS Historical Quadrangle in GeoPDF.
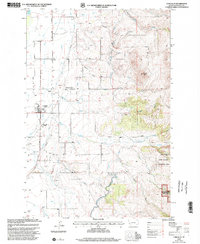
USGS Historical Quadrangle in GeoPDF.
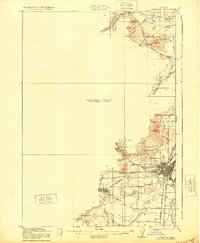
USGS Historical Quadrangle in GeoPDF.
This dataset shows the locations of community garbage cleanups. The attributes show how many pieces of garbage were picked up at the location.
This data set contains imagery from the National Agriculture Imagery Program (NAIP). The NAIP program is administered by USDA FSA and has been established to support two main FSA strategic goals centered on agricultural production. These are, increase stewardship of America's natural resources while enhancing the environment, and to ensure commodities are procured and distributed effectively and efficiently to increase food security. The NAIP program supports these goals by acquiring and providing ortho imagery that has been collected during the agricultural growing season in the U.S. The NAIP ortho imagery is tailored to meet FSA requirements and is a fundamental tool used to support FSA farm and conservation programs....
This data set contains imagery from the National Agriculture Imagery Program (NAIP). The NAIP program is administered by USDA FSA and has been established to support two main FSA strategic goals centered on agricultural production. These are, increase stewardship of America's natural resources while enhancing the environment, and to ensure commodities are procured and distributed effectively and efficiently to increase food security. The NAIP program supports these goals by acquiring and providing ortho imagery that has been collected during the agricultural growing season in the U.S. The NAIP ortho imagery is tailored to meet FSA requirements and is a fundamental tool used to support FSA farm and conservation programs....
USGS Historical Quadrangle in GeoPDF.
USGS Historical Quadrangle in GeoPDF.
USGS Historical Quadrangle in GeoPDF.
USGS Historical Quadrangle in GeoPDF.
|

|
