Filters: Tags: Costilla County (X)
169 results (55ms)|
Filters
Date Range
Extensions Types Contacts
Categories Tag Types Tag Schemes |
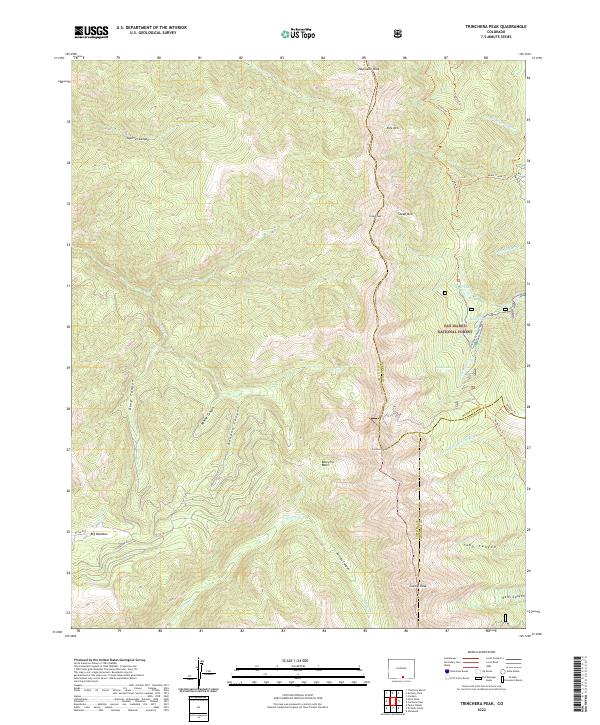
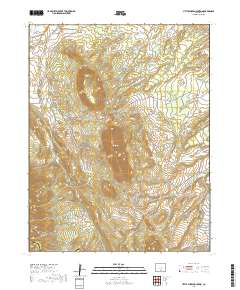
Layered geospatial PDF 7.5 Minute Quadrangle Map. Layers of geospatial data include orthoimagery, roads, grids, geographic names, elevation contours, hydrography, and other selected map features. This map is derived from GIS (geospatial information system) data. It represents a repackaging of GIS data in traditional map form, not creation of new information. The geospatial data in this map are from selected National Map data holdings and other government sources.
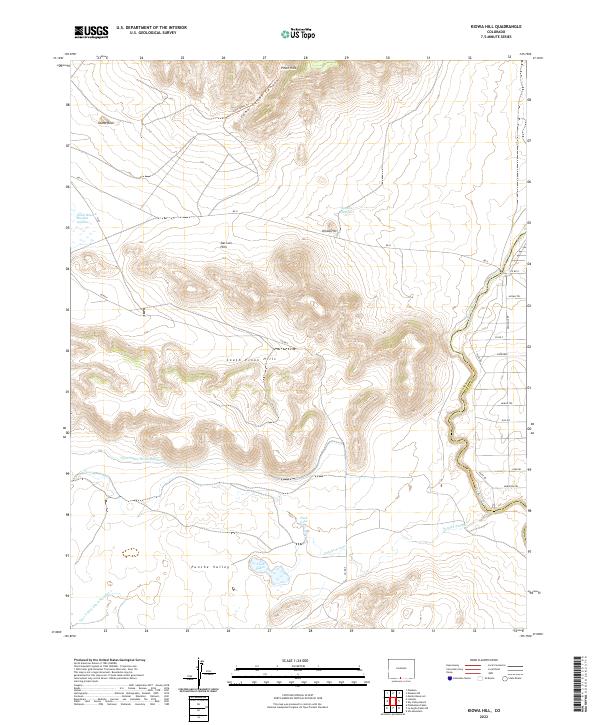
Layered geospatial PDF 7.5 Minute Quadrangle Map. Layers of geospatial data include orthoimagery, roads, grids, geographic names, elevation contours, hydrography, and other selected map features. This map is derived from GIS (geospatial information system) data. It represents a repackaging of GIS data in traditional map form, not creation of new information. The geospatial data in this map are from selected National Map data holdings and other government sources.
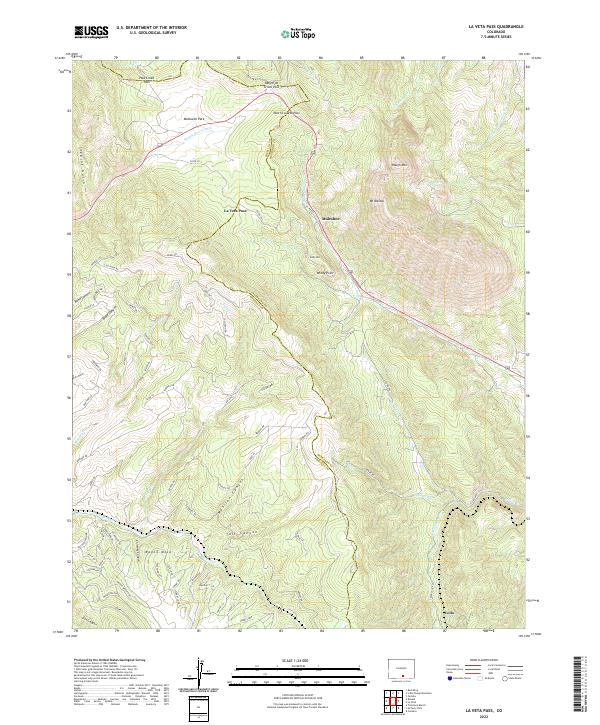
Layered geospatial PDF 7.5 Minute Quadrangle Map. Layers of geospatial data include orthoimagery, roads, grids, geographic names, elevation contours, hydrography, and other selected map features. This map is derived from GIS (geospatial information system) data. It represents a repackaging of GIS data in traditional map form, not creation of new information. The geospatial data in this map are from selected National Map data holdings and other government sources.

These vector contour lines are derived from the 3D Elevation Program using automated and semi-automated processes. They were created to support 1:24,000-scale CONUS and Hawaii, 1:25,000-scale Alaska, and 1:20,000-scale Puerto Rico / US Virgin Island topographic map products, but are also published in this GIS vector format. Contour intervals are assigned by 7.5-minute quadrangle, so this vector dataset is not visually seamless across quadrangle boundaries. The vector lines have elevation attributes (in feet above mean sea level on NAVD88), but this dataset does not carry line symbols or annotation.
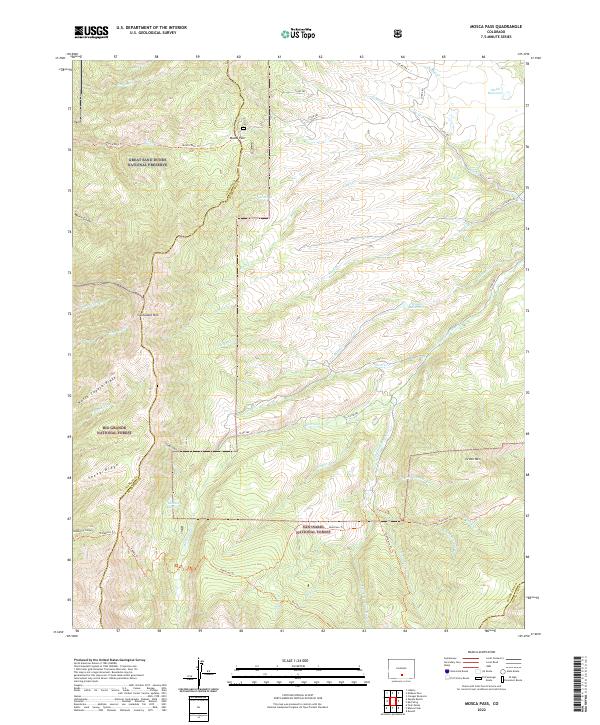
Layered geospatial PDF 7.5 Minute Quadrangle Map. Layers of geospatial data include orthoimagery, roads, grids, geographic names, elevation contours, hydrography, and other selected map features. This map is derived from GIS (geospatial information system) data. It represents a repackaging of GIS data in traditional map form, not creation of new information. The geospatial data in this map are from selected National Map data holdings and other government sources.
This dataset includes the magnetotelluric (MT) sounding data collected in 2006 in the Southern San Luis Valley, Colorado. The U.S. Geological Survey conducted a series of multidisciplinary studies, including MT surveys, in the San Luis Valley to improve understanding of the hydrogeology of the Santa Fe Group and the nature of the sedimentary deposits comprising the principal groundwater aquifers of the Rio Grande rift. The shallow unconfined and the deeper confined Santa Fe Group aquifers in the San Luis Basin are the main sources of municipal water for the region. The population of the San Luis Valley region is growing rapidly and water shortfalls could have serious consequences. Future growth and land management...
Types: Citation;
Tags: Colorado,
Costilla County,
Electromagnetic surveying,
GPS measurement,
Geophysics,
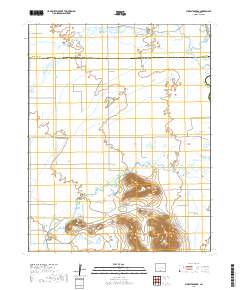
Layered geospatial PDF 7.5 Minute Quadrangle Map. Layers of geospatial data include orthoimagery, roads, grids, geographic names, elevation contours, hydrography, and other selected map features. This map is derived from GIS (geospatial information system) data. It represents a repackaging of GIS data in traditional map form, not creation of new information. The geospatial data in this map are from selected National Map data holdings and other government sources.
Layered geospatial PDF 7.5 Minute Quadrangle Map. Layers of geospatial data include orthoimagery, roads, grids, geographic names, elevation contours, hydrography, and other selected map features. This map is derived from GIS (geospatial information system) data. It represents a repackaging of GIS data in traditional map form, not creation of new information. The geospatial data in this map are from selected National Map data holdings and other government sources.
Layered geospatial PDF 7.5 Minute Quadrangle Map. Layers of geospatial data include orthoimagery, roads, grids, geographic names, elevation contours, hydrography, and other selected map features. This map is derived from GIS (geospatial information system) data. It represents a repackaging of GIS data in traditional map form, not creation of new information. The geospatial data in this map are from selected National Map data holdings and other government sources.
Layered geospatial PDF 7.5 Minute Quadrangle Map. Layers of geospatial data include orthoimagery, roads, grids, geographic names, elevation contours, hydrography, and other selected map features. This map is derived from GIS (geospatial information system) data. It represents a repackaging of GIS data in traditional map form, not creation of new information. The geospatial data in this map are from selected National Map data holdings and other government sources.
Layered geospatial PDF 7.5 Minute Quadrangle Map. Layers of geospatial data include orthoimagery, roads, grids, geographic names, elevation contours, hydrography, and other selected map features. This map is derived from GIS (geospatial information system) data. It represents a repackaging of GIS data in traditional map form, not creation of new information. The geospatial data in this map are from selected National Map data holdings and other government sources.
Layered geospatial PDF 7.5 Minute Quadrangle Map. Layers of geospatial data include orthoimagery, roads, grids, geographic names, elevation contours, hydrography, and other selected map features. This map is derived from GIS (geospatial information system) data. It represents a repackaging of GIS data in traditional map form, not creation of new information. The geospatial data in this map are from selected National Map data holdings and other government sources.
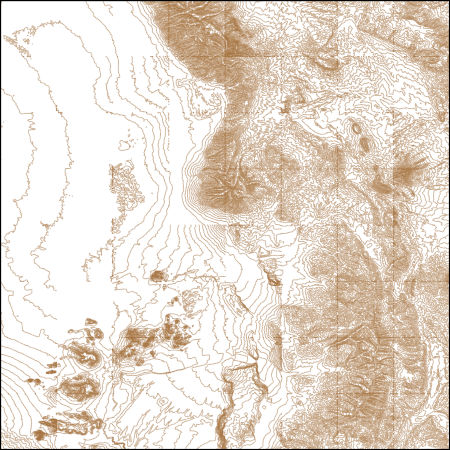
These vector contour lines are derived from the 3D Elevation Program using automated and semi-automated processes. They were created to support 1:24,000-scale CONUS and Hawaii, 1:25,000-scale Alaska, and 1:20,000-scale Puerto Rico / US Virgin Island topographic map products, but are also published in this GIS vector format. Contour intervals are assigned by 7.5-minute quadrangle, so this vector dataset is not visually seamless across quadrangle boundaries. The vector lines have elevation attributes (in feet above mean sea level on NAVD88), but this dataset does not carry line symbols or annotation.
Alluvial basin boundaries in the Upper Rio Grande Basin (URGB) were a needed dataset for the groundwater component of the URGB Focus Area Study (FAS). A literature and data search revealed not all of the alluvial fill basins existed in a digital format that could be imported and used in a Geographic Information System (GIS). Available resources such as georeferenced report figures, digital elevation models (DEMs), principal aquifer dataset, surficial geology, and structural features, such as faults, were used to aid in defining the alluvial basin boundaries. An Esri ArcGIS geodatabase was created to house the final digitized dataset of the following alluvial basins: San Luis, Espanola, Socorro, La Jencia, San Marcial,...
Types: Map Service,
OGC WFS Layer,
OGC WMS Layer,
OGC WMS Service;
Tags: Abiquiu Reservoir,
Ahumada,
Alamosa,
Alamosa,
Alamosa County,
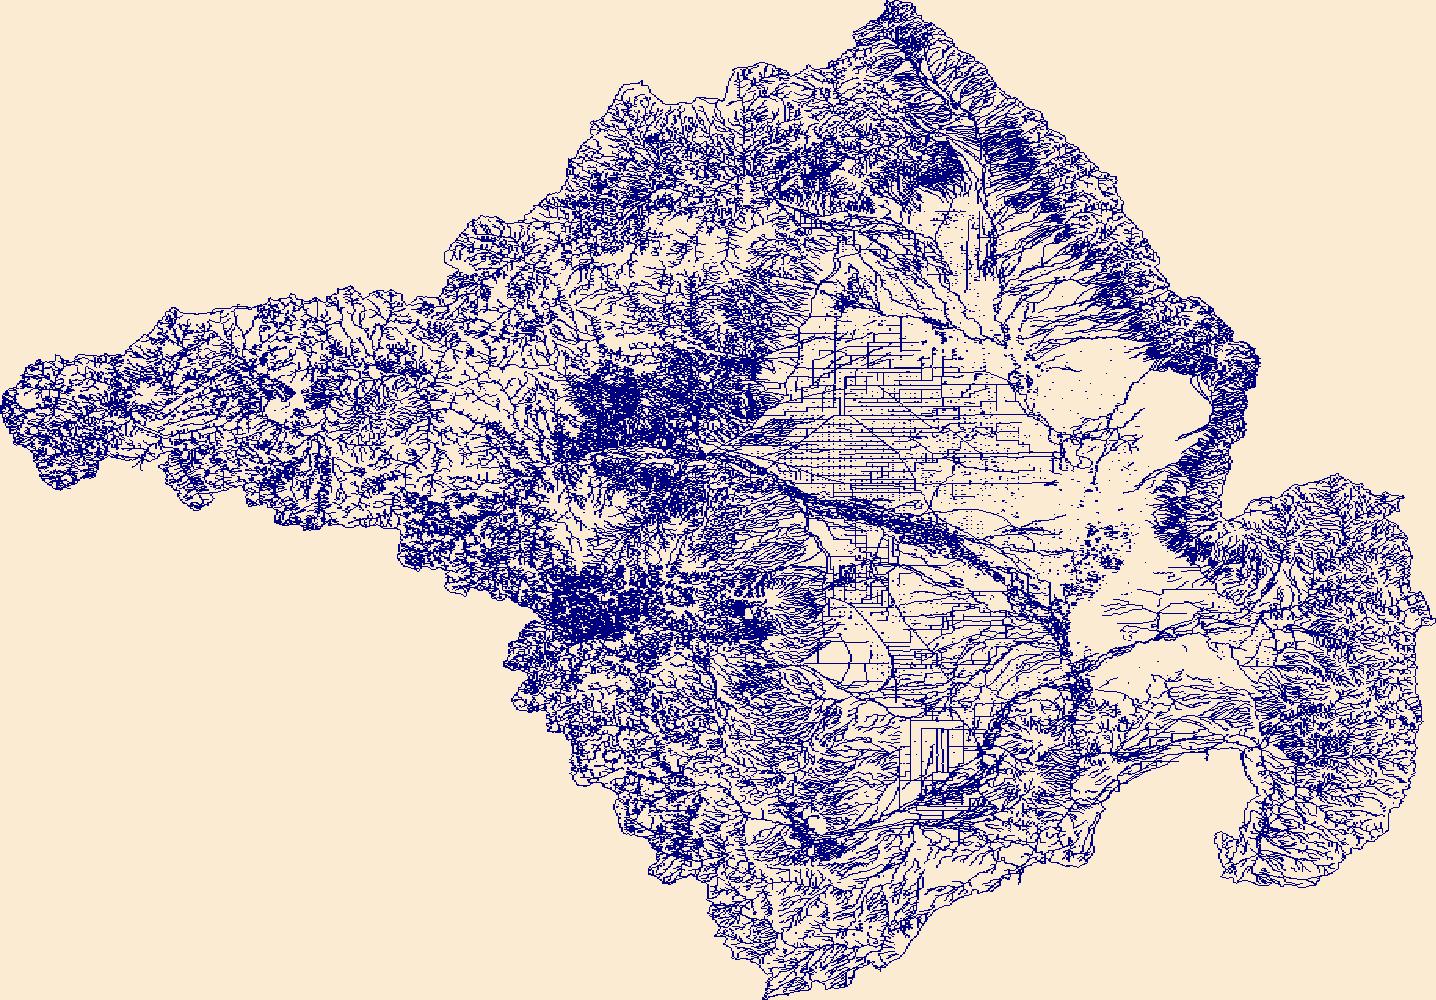
The High Resolution National Hydrography Dataset Plus (NHDPlus HR) is an integrated set of geospatial data layers, including the best available National Hydrography Dataset (NHD), the 10-meter 3D Elevation Program Digital Elevation Model (3DEP DEM), and the National Watershed Boundary Dataset (WBD). The NHDPlus HR combines the NHD, 3DEP DEMs, and WBD to create a stream network with linear referencing, feature naming, "value added attributes" (VAAs), elevation-derived catchments, and other features for hydrologic data analysis. The stream network with linear referencing is a system of data relationships applied to hydrographic systems so that one stream reach "flows" into another and "events" can be tied to and traced...
This dataset includes the magnetotelluric (MT) sounding data collected in 2006 in the Southern San Luis Valley, Colorado. The U.S. Geological Survey conducted a series of multidisciplinary studies, including MT surveys, in the San Luis Valley to improve understanding of the hydrogeology of the Santa Fe Group and the nature of the sedimentary deposits comprising the principal groundwater aquifers of the Rio Grande rift. The shallow unconfined and the deeper confined Santa Fe Group aquifers in the San Luis Basin are the main sources of municipal water for the region. The population of the San Luis Valley region is growing rapidly and water shortfalls could have serious consequences. Future growth and land management...
Types: Citation;
Tags: Colorado,
Costilla County,
Electromagnetic surveying,
GPS measurement,
Geophysics,
This dataset includes the locations of magnetotelluric (MT) stations collected in 2006 in the Southern San Luis Valley, Colorado. The U.S. Geological Survey conducted a series of multidisciplinary studies, including MT surveys, in the San Luis Valley to improve understanding of the hydrogeology of the Santa Fe Group and the nature of the sedimentary deposits comprising the principal groundwater aquifers of the Rio Grande rift. The shallow unconfined and the deeper confined Santa Fe Group aquifers in the San Luis Basin are the main sources of municipal water for the region. The population of the San Luis Valley region is growing rapidly and water shortfalls could have serious consequences. Future growth and land...
Categories: Data;
Types: Citation,
Downloadable,
Map Service,
OGC WFS Layer,
OGC WMS Layer,
Shapefile;
Tags: Colorado,
Costilla County,
Electromagnetic surveying,
GIS,
GPS measurement,
Layered geospatial PDF 7.5 Minute Quadrangle Map. Layers of geospatial data include orthoimagery, roads, grids, geographic names, elevation contours, hydrography, and other selected map features. This map is derived from GIS (geospatial information system) data. It represents a repackaging of GIS data in traditional map form, not creation of new information. The geospatial data in this map are from selected National Map data holdings and other government sources.
Layered geospatial PDF 7.5 Minute Quadrangle Map. Layers of geospatial data include orthoimagery, roads, grids, geographic names, elevation contours, hydrography, and other selected map features. This map is derived from GIS (geospatial information system) data. It represents a repackaging of GIS data in traditional map form, not creation of new information. The geospatial data in this map are from selected National Map data holdings and other government sources.
|

|
