Filters: Tags: District of Columbia (X) > Types: Citation (X)
66 results (114ms)|
Filters
Date Range
Extensions Types Contacts
Categories Tag Types
|
This dataset contains watershed means of estimated percent impervious surfaces for three time periods: 1992, 2002, and 2012. Estimates are based on coefficients derived from comparing land use of the 2012 NAWQA Wall-to-wall Anthropogenic Land-use Trends (NWALT) product to the 2011 National Land Cover Database (NLCD) imperviousness, then applying those coefficients to previous years (1974-2002) of the NWALT dataset.
Categories: Data;
Types: Citation;
Tags: Chesapeake Bay,
Delaware,
District of Columbia,
James River,
Maryland,
The U. S. Geological Survey (USGS) makes long-term seismic hazard forecasts that are used in building codes. The hazard models usually consider only natural seismicity; non-tectonic (man-made) earthquakes are excluded because they are transitory or too small. In the past decade, however, thousands of earthquakes related to underground fluid injection have occurred in the central and eastern U.S. (CEUS), and some have caused damage. In response, the USGS is now also making short-term forecasts that account for the hazard from these induced earthquakes. A uniform earthquake catalog is assembled by combining and winnowing pre-existing source catalogs. Seismicity statistics are analyzed to develop recurrence models,...
Layers of geospatial data include contours, boundaries, land cover, hydrography, roads, transportation, geographic names, structures, and other selected map features.
Types: Citation;
Tags: 7.5 x 7.5 minute,
7_5_Min,
Alexandria County,
Arlington County,
Combined Vector,
WHISPers stands for Wildlife Health Information Sharing Partnership - event reporting system. It is a web-based repository for sharing basic information about historic and ongoing wildlife mortality (death) and morbidity (illness) events. The system possesses a searchable archive of wildlife mortality and morbidity event data that is available to the public. The information is opportunistically collected and does not reflect all the mortality events that occur in North America.
This data set represents the results of calculations of hazard curves for a grid of points with a spacing of 0.05 degrees in latitude and longitude. It represents the chance of experiencing damaging earthquakes for fixed ground shaking levels that corresponds with MMI = VI. The values are obtained by averaging the probability of experiencing MMI = VI based on a peak ground acceleration value of 0.1155 g for site class D, and the probability of experiencing MMI = VI based on 1.0-second spectral acceleration value of 0.102 g for site class D. The data are for the Central and Eastern United States and are based on the one-year model.
Categories: Data;
Types: Citation,
Downloadable,
Map Service,
OGC WFS Layer,
OGC WMS Layer,
Shapefile;
Tags: Alabama,
Arizona,
Arkansas,
Colorado,
Connecticut,
This data set represents the hazard curves for a grid of points with a spacing of 0.05 degrees in latitude and longitude. It represents the annual rate of exceedance versus peak ground acceleration.
This data set provides industrial-scale onshore wind turbine locations, corresponding facility information, and turbine technical specifications, in the United States to March 2014. The database has nearly 49,000 wind turbine records that have been collected, digitized, locationally verified, and internally quality assured and quality controlled. Turbines from the Federal Aviation Administration Digital Obstacle File, product date March 2, 2014, were used as the primary source of turbine data points. Verification of the position of turbines was done by visual interpretation using high-resolution aerial imagery in ESRI ArcGIS Desktop. Turbines without Federal Aviation Administration Obstacle Repository System (FAA...
Categories: Data;
Types: ArcGIS REST Map Service,
Citation,
Map Service;
Tags: Alabama,
Alaska,
Arizona,
Arkansas,
California,
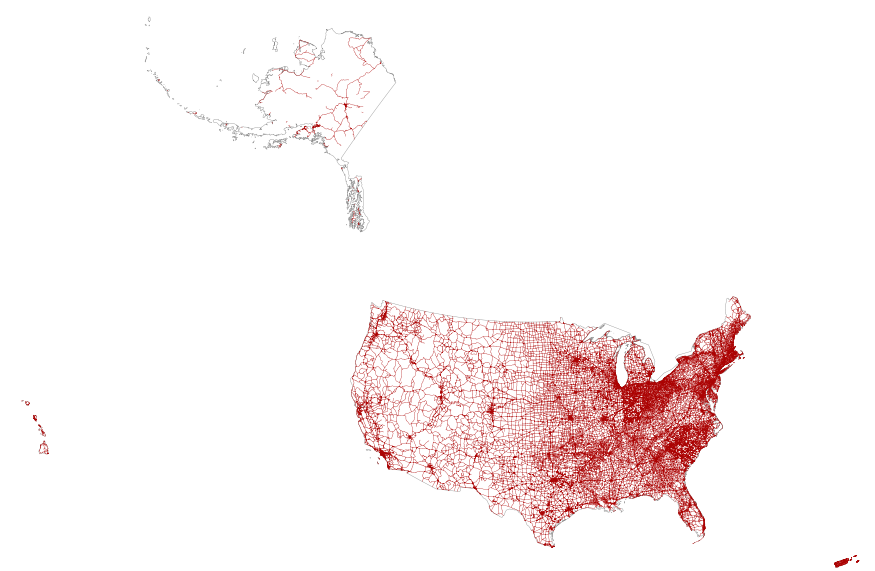
This map layer portrays the major roads in the United States, Puerto Rico, and the U.S. Virgin Islands. The file was produced by joining the individual State roads layers from the National Highway Planning Network (NHPN), Geographic Data Technology (GDT) Dynamap, and TIGER/Line files. This is a revised version of the July 2012 map layer.
This dataset contains values of normal reservoir storage in units of acre-feet per km2, for three time periods: 1992, 2002, and 2012. Values are derived from a slightly-modified version of the National Inventory of Dams (NID) 2013 dataset, for which approximately 10% of records had the dam completion date estimated.
Categories: Data;
Types: Citation;
Tags: Chesapeake Bay,
Delaware,
District of Columbia,
James River,
Maryland,
This data set represents the results of calculations of hazard curves for a grid of points with a spacing of 0.05 degrees in latitude and longitude. This particular data set is for horizontal spectral response acceleration for 1.0-second period with a 1 percent probability of exceedance in 1 year. The data are for the Central and Eastern United States and are based on the one-year model.
Categories: Data;
Types: Citation,
Downloadable,
Map Service,
OGC WFS Layer,
OGC WMS Layer,
Shapefile;
Tags: Alabama,
Arizona,
Arkansas,
Colorado,
Connecticut,
The U. S. Geological Survey (USGS) makes long-term seismic hazard forecasts that are used in building codes. The hazard models usually consider only natural seismicity; non-tectonic (man-made) earthquakes are excluded because they are transitory or too small. In the past decade, however, thousands of earthquakes related to underground fluid injection have occurred in the central and eastern U.S. (CEUS), and some have caused damage. In response, the USGS is now also making short-term forecasts that account for the hazard from these induced earthquakes. A uniform earthquake catalog is assembled by combining and winnowing pre-existing source catalogs. Seismicity statistics are analyzed to develop recurrence models,...
The U. S. Geological Survey (USGS) makes long-term seismic hazard forecasts that are used in building codes. The hazard models usually consider only natural seismicity; non-tectonic (man-made) earthquakes are excluded because they are transitory or too small. In the past decade, however, thousands of earthquakes related to underground fluid injection have occurred in the central and eastern U.S. (CEUS), and some have caused damage. In response, the USGS is now also making short-term forecasts that account for the hazard from these induced earthquakes. A uniform earthquake catalog is assembled by combining and winnowing pre-existing, authoritative source catalogs. Seismicity statistics are analyzed to develop recurrence...
Fish occurrence data to support high-resolution distribution models and test various community and macroecological hypotheses have not been available at the national scale. We present IchthyMaps, a database of high-quality historical fish occurrences covering fishes of the conterminous United States. Designed on the principles of metacommunity ecology, IchthyMaps is a compilation of presence records from atlases up to 1990, at the resolution of the 1:100,000 National Hydrography Database Plus (NHDPlus) inter-confluence stream segment, readily aggregated into hierarchically coarser units (e.g. hydrologic unit code 8-digit and 12-digit watersheds). IchthyMaps contains about 606,550 presence records for 1,038 species...
Categories: Data,
Publication;
Types: Citation;
Tags: Alabama,
Arizona,
Arkansas,
Biological Data,
Biological sampling,
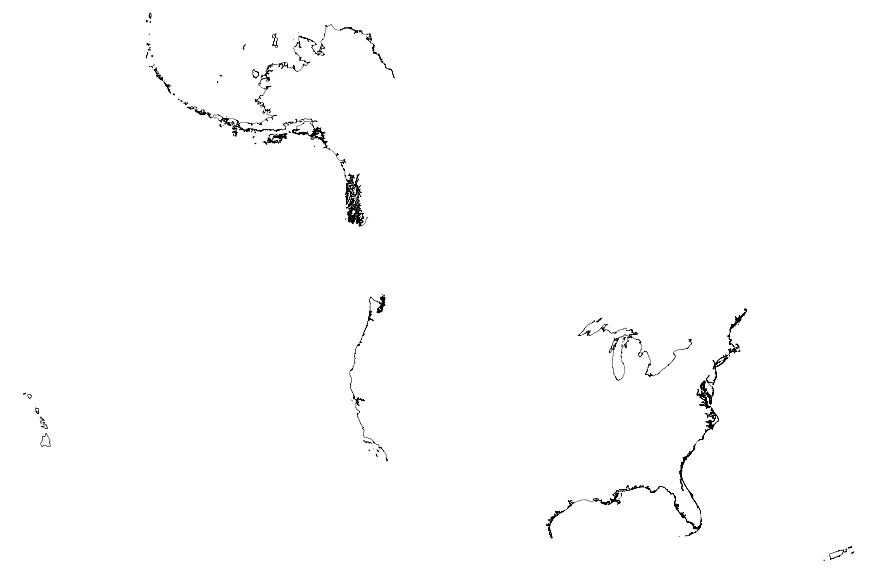
This map layer portrays the coastline of the United States, Puerto Rico, and the U.S. Virgin Islands. The United States shoreline of the Great Lakes is also included. This is a revised version of the July 2012 map layer.
This data set represents the hazard curves for a grid of points with a spacing of 0.05 degrees in latitude and longitude. It represents the annual rate of exceedance versus 0.2-second spectral response acceleration.
This dataset contains values of soils, climate, hydrologic, topographic, and other geographic characteristics such as drainage area. These are considered "static" characteristics, which do not change over the time period of this study.
Categories: Data;
Types: Citation;
Tags: Chesapeake Bay,
Delaware,
District of Columbia,
James River,
Maryland,
This dataset provides estimates of annual and seasonal precipitation for selected Chesapeake Bay watersheds. Season 1 is November-February; season 2 is March-June; and season 3 is July-October.
Categories: Data;
Types: Citation;
Tags: Chesapeake Bay,
Delaware,
District of Columbia,
James River,
Maryland,

Layers of geospatial data include contours, boundaries, land cover, hydrography, roads, transportation, geographic names, structures, and other selected map features.
Types: Citation;
Tags: 7.5 x 7.5 minute,
7_5_Min,
Alexandria County,
Arlington County,
Combined Vector,
THIS IS A HISTORICAL RECORD. As of December 17, 2021, the BISON application will no longer be available online and has been replaced by https://www.gbif.us. The BISON APIs are still available at https://bison.usgs.gov/#api and the Integrated Publishing Toolkit is still available at https://bison.usgs.gov/ipt. The USGS Biodiversity Information Serving Our Nation (BISON) project is an online all-species mapping information system consisting of a large collection of species occurrence datasets (e.g., plants and animals) found in the United States, U.S. Territories, U.S. marine Exclusive Economic Zones (EEZ), and Canada, with relevant geospatial layers. Species occurrences are records of organisms at a particular...
This CSV file contains 21 dam metrics representing stream fragmentation and flow alteration for nearly 2.3 million stream reaches in the conterminous USA. Dam metrics fall into four main categories: segment-based, count and density, distance-based, and cumulative reservoir storage (described below). These data were developed using spatially verified large dam locations (n=49,468) primarily from the National Anthropogenic Barrier Dataset (NABD) that were spatially linked to the National Hydrography Dataset Plus version 1 (NHDPlusV1). These dam metrics have been summarized using the unique identifier field native to the NHDPlusV1 (COMID) which can be used to join this table to spatial layers and data tables of the...
Categories: Data;
Types: Citation;
Tags: 2015 National Assessment,
2015 National Assessment,
2015 National Assessment,
Alabama,
Arizona,
|

|
