Filters: Tags: District of Columbia (X) > Date Range: {"choice":"year"} (X)
115 results (174ms)|
Filters
Date Types (for Date Range)
Types Contacts
Categories Tag Types
|
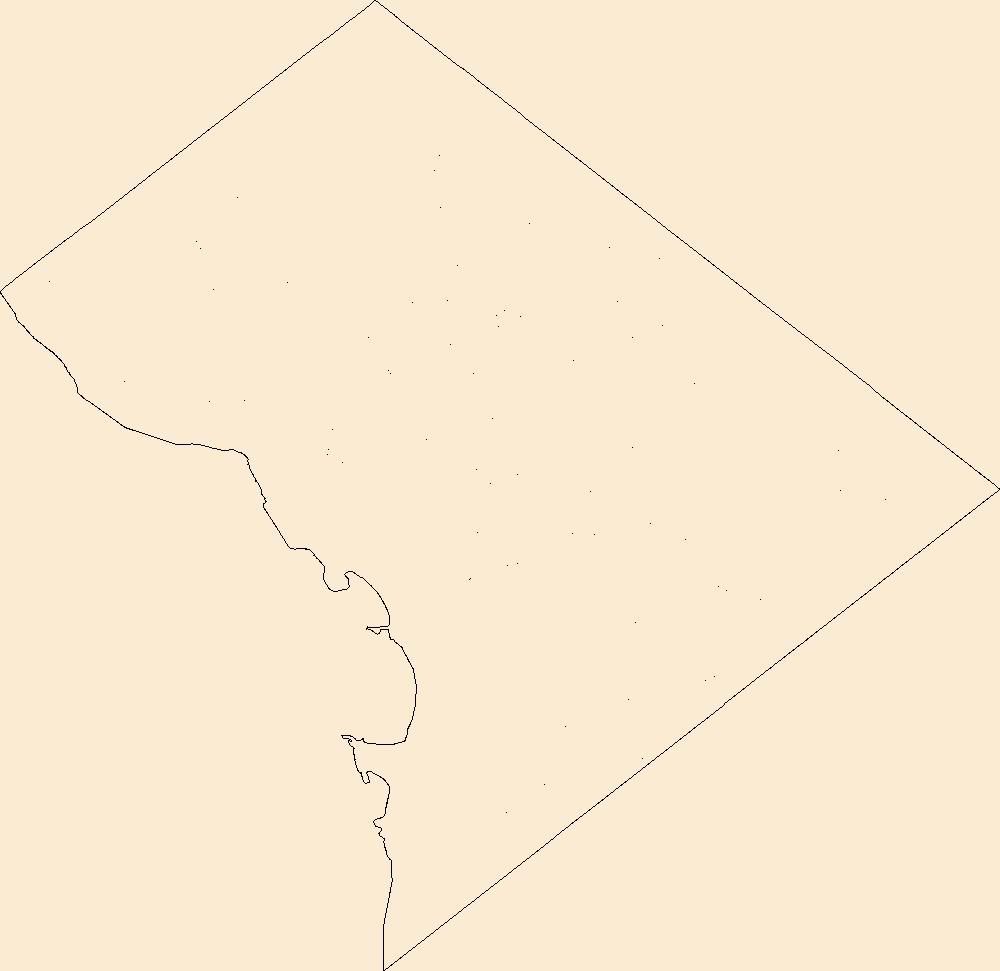
Geospatial data includes structures and other selected map features.

The Geographic Names Information System (GNIS) is the Federal standard for geographic nomenclature. The U.S. Geological Survey developed the GNIS for the U.S. Board on Geographic Names, a Federal inter-agency body chartered by public law to maintain uniform feature name usage throughout the Government and to promulgate standard names to the public. The GNIS is the official repository of domestic geographic names data; the official vehicle for geographic names use by all departments of the Federal Government; and the source for applying geographic names to Federal electronic and printed products of all types.
The Geographic Names Information System (GNIS) is the Federal standard for geographic nomenclature. The U.S. Geological Survey developed the GNIS for the U.S. Board on Geographic Names, a Federal inter-agency body chartered by public law to maintain uniform feature name usage throughout the Government and to promulgate standard names to the public. The GNIS is the official repository of domestic geographic names data; the official vehicle for geographic names use by all departments of the Federal Government; and the source for applying geographic names to Federal electronic and printed products of all types.
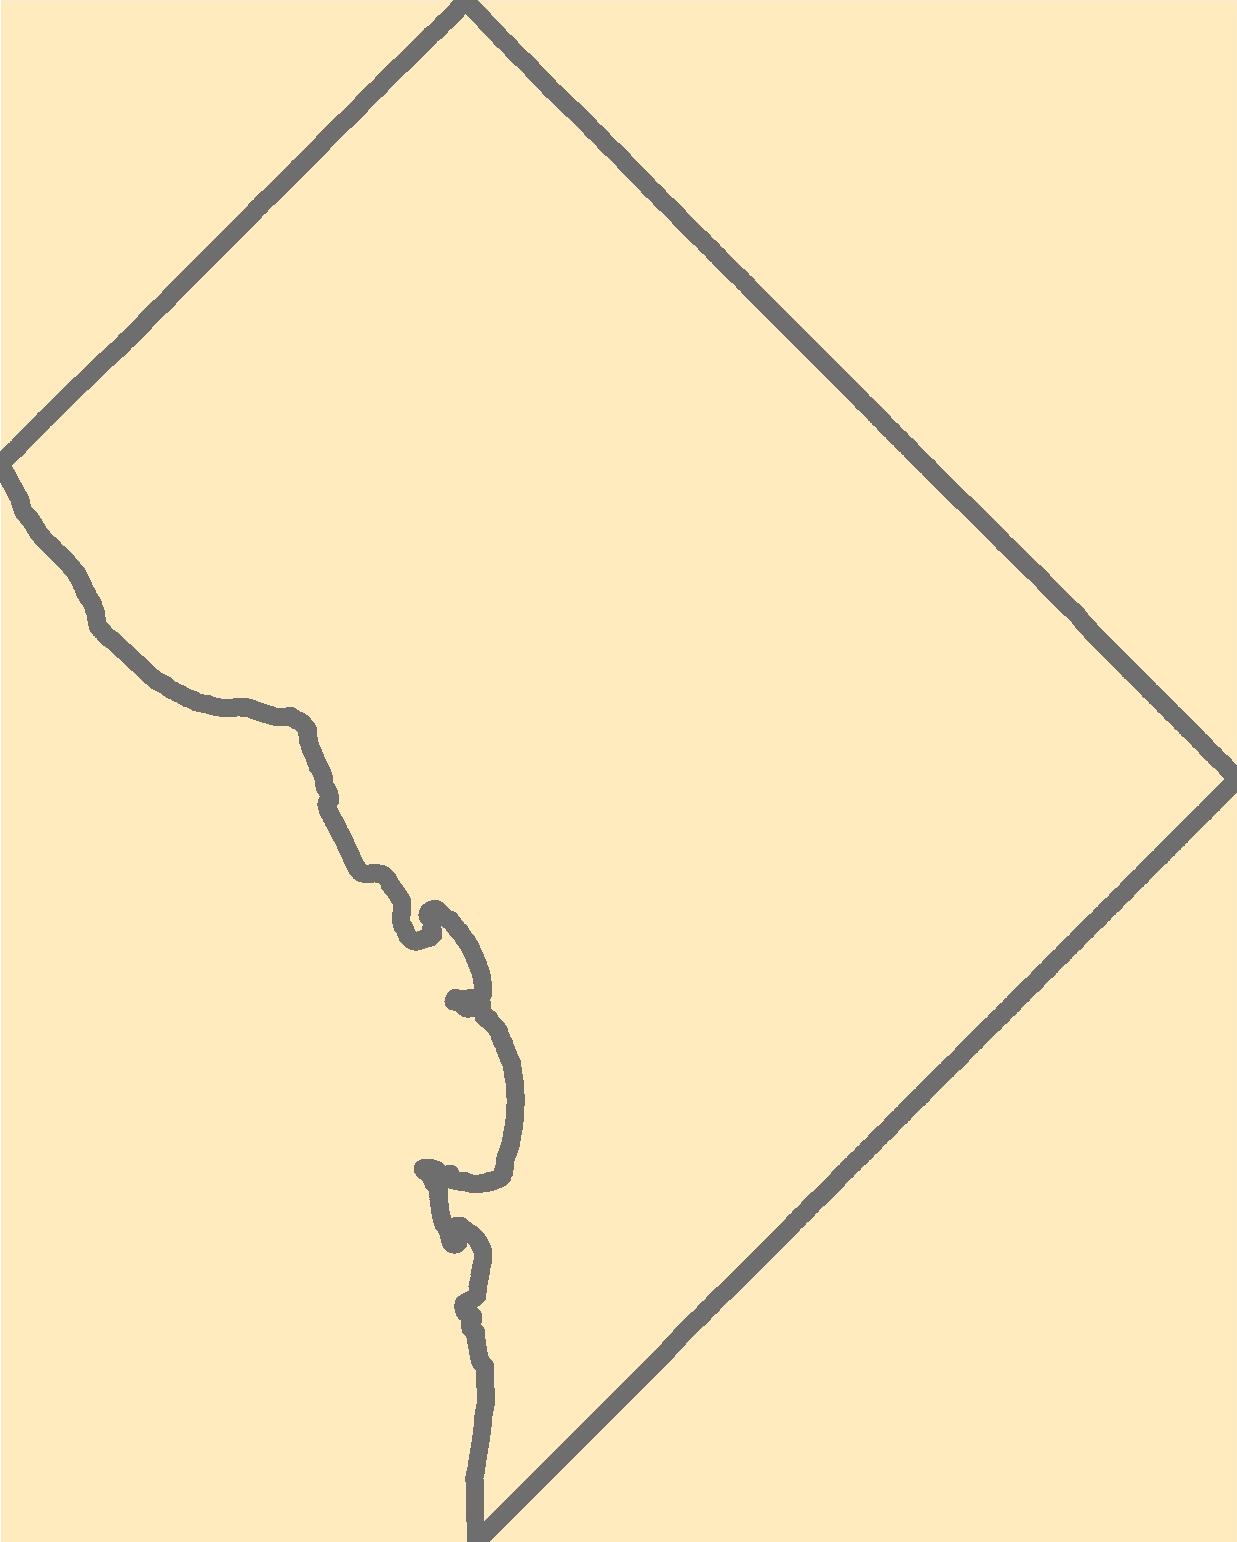
These vector contour lines are derived from the 3D Elevation Program using automated and semi-automated processes. They were created to support 1:24,000-scale CONUS and Hawaii, 1:25,000-scale Alaska, and 1:20,000-scale Puerto Rico / US Virgin Island topographic map products, but are also published in this GIS vector format. Contour intervals are assigned by 7.5-minute quadrangle, so this vector dataset is not visually seamless across quadrangle boundaries. The vector lines have elevation attributes (in feet above mean sea level on NAVD88), but this dataset does not carry line symbols or annotation.
This child item describes Python code used to estimate average yearly and monthly tourism per 1000 residents within public-supply water service areas. Increases in population due to tourism may impact amounts of water used by public-supply water systems. This data release contains model input datasets, Python code used to develop the tourism information, and output estimates of tourism. This dataset is part of a larger data release using machine learning to predict public supply water use for 12-digit hydrologic units from 2000-2020. Output from this code was used as an input feature in the public supply delivery and water use machine learning models. This page includes the following files: tourism_input_data.zip...
This child item describes a public supply delivery machine learning model that was developed to estimate public-supply deliveries. Publicly supplied water may be delivered to domestic users or to commercial, industrial, institutional, and irrigation (CII) users. This model predicts total, domestic, and CII per capita rates for public-supply water service areas within the conterminous United States for 2009-2020. This child item contains model input datasets, code used to build the delivery machine learning model, and national predictions. This dataset is part of a larger data release using machine learning to predict public-supply water use for 12-digit hydrologic units from 2000-2020. This page includes the following...
This child item describes Python code used to query census data from the TigerWeb Representational State Transfer (REST) services and the U.S. Census Bureau Application Programming Interface (API). These data were needed as input feature variables for a machine learning model to predict public supply water use for the conterminous United States. Census data were retrieved for public-supply water service areas, but the census data collector could be used to retrieve data for other areas of interest. This dataset is part of a larger data release using machine learning to predict public supply water use for 12-digit hydrologic units from 2000-2020. Data retrieved by the census data collector code were used as input...
This map layer shows major ports in the United States, Puerto Rico, and the U.S. Virgin Islands. A port is a city, town, or urban area with a harbor where ships load or unload. This is a revised version of the July 2012 map layer.
Categories: Data;
Types: Downloadable,
Map Service,
OGC WFS Layer,
OGC WMS Layer,
Shapefile;
Tags: Academics & scientific researchers,
Alabama,
Arizona,
Arkansas,
California,
This data set represents the extent, approximate location and type of wetlands and deepwater habitats in the United States and its Territories. These data delineate the areal extent of wetlands and surface waters as defined by Cowardin et al. (1979). Certain wetland habitats are excluded from the National mapping program because of the limitations of aerial imagery as the primary data source used to detect wetlands. These habitats include seagrasses or submerged aquatic vegetation that are found in the intertidal and subtidal zones of estuaries and near shore coastal waters. Some deepwater reef communities (coral or tuberficid worm reefs) have also been excluded from the inventory. These habitats, because of their...
Categories: Data;
Types: Map Service,
OGC WFS Layer,
OGC WMS Layer,
OGC WMS Service;
Tags: Academics & scientific researchers,
Alabama,
Alabama,
Alaska,
Arizona,
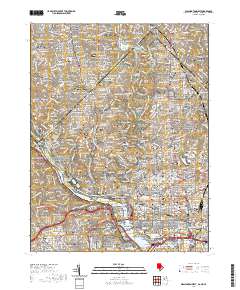
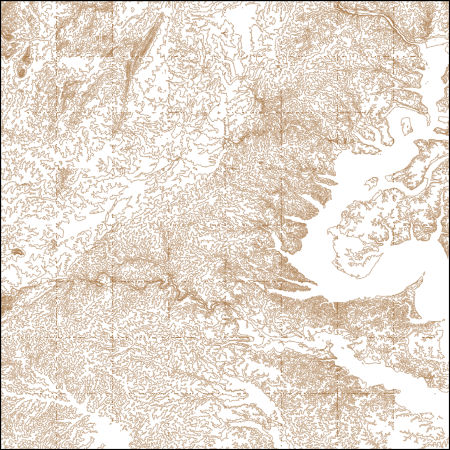
Layered geospatial PDF 7.5 Minute Quadrangle Map. Layers of geospatial data include orthoimagery, roads, grids, geographic names, elevation contours, hydrography, and other selected map features. This map is derived from GIS (geospatial information system) data. It represents a repackaging of GIS data in traditional map form, not creation of new information. The geospatial data in this map are from selected National Map data holdings and other government sources.
Freshwater salinization is an emerging issue for freshwater environments in the Chesapeake Bay, USA region. Salinization is often described by measurements of specific conductance (SC). This data release contains specific conductance observations collected by multiple regional agencies for streams within the Chesapeake Bay Watershed. This inventory compiles and harmonizes data from the Water Quality Portal (WQP), which is a data repository developed by the National Water Quality Monitoring Council and supported by the U.S. Environmental Protection Agency and U.S. Geological Survey, and the U.S. Geological Survey National Water Information System (NWIS). Both discrete measures of SC, which are single measures taken...
Categories: Data;
Tags: Chesapeake Bay watershed,
Delaware,
District of Columbia,
Hydrology,
Maryland,
The download for this dataset includes TNC’s full Northeastern Aquatic Habitat Classification System: stream size, stream temperature, stream gradient, stream geology, lakes and catchments. This dataset represents the results (9/30/2008) of the Northeastern Aquatic Habitat Classification System (NAHCS) GIS map for streams and rivers. This classification focused on mapping a stream habitat types across 13 northeastern states (ME, NH, VT, MA, CT, RI, NY, NJ, PA, MD, DC, DE, VA, WV). Stream and river centerlines were extracted from the USGS National Hydrography Dataset Plus (NH-Plus) 2006 1:100,000 data. These reaches were attributed and placed into classes representing their biopysical setting in terms of stream...
Categories: Data;
Types: ArcGIS REST Map Service,
ArcGIS Service Definition,
Downloadable,
Map Service;
Tags: Connecticut,
Connecticut,
Data,
Delaware,
Delaware,
The data presented here are blacklegged tick nymph densities, white-tailed deer densities, and Borrelia burgdorferi (causative agent of Lyme disease) prevalences for eight national parks in the eastern United States from 2014-2022.
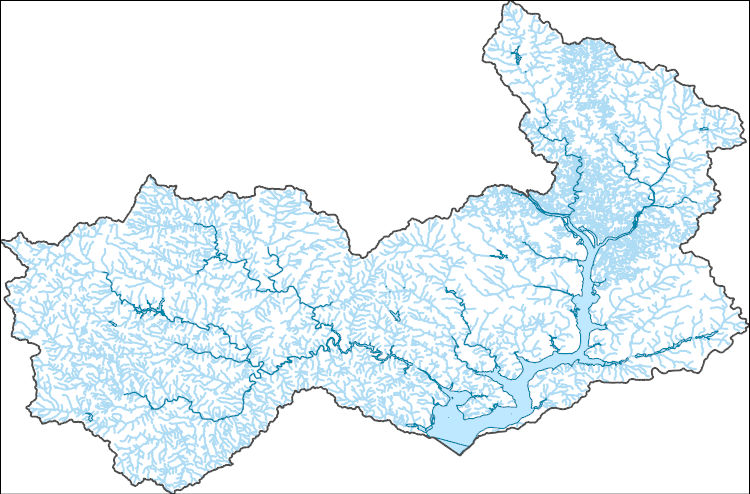
The National Hydrography Dataset (NHD) is a feature-based database that interconnects and uniquely identifies the stream segments or reaches that make up the nation's surface water drainage system. NHD data was originally developed at 1:100,000-scale and exists at that scale for the whole country. This high-resolution NHD, generally developed at 1:24,000/1:12,000 scale, adds detail to the original 1:100,000-scale NHD. (Data for Alaska, Puerto Rico and the Virgin Islands was developed at high-resolution, not 1:100,000 scale.) Local resolution NHD is being developed where partners and data exist. The NHD contains reach codes for networked features, flow direction, names, and centerline representations for areal water...

This dataset, termed "GAGES II", an acronym for Geospatial Attributes of Gages for Evaluating Streamflow, version II, provides geospatial data and classifications for 9,322 stream gages maintained by the U.S. Geological Survey (USGS). It is an update to the original GAGES, which was published as a Data Paper on the journal Ecology's website (Falcone and others, 2010b) in 2010. The GAGES II dataset consists of gages which have had either 20+ complete years (not necessarily continuous) of discharge record since 1950, or are currently active, as of water year 2009, and whose watersheds lie within the United States, including Alaska, Hawaii, and Puerto Rico. Reference gages were identified based on indicators that they...
Types: Map Service,
OGC WFS Layer,
OGC WMS Layer,
OGC WMS Service;
Tags: Alabama,
Alaska,
All 50 states,
Arizona,
Arkansas,
This dataset represents the results (9/30/2008) of the Northeastern Aquatic Habitat Classification System (NAHCS) GIS map for streams and rivers. This classification focused on mapping a stream habitat types across 13 northeastern states (ME, NH, VT, MA, CT, RI, NY, NJ, PA, MD, DC, DE, VA, WV). Stream and river centerlines were extracted from the USGS National Hydrography Dataset Plus (NH-Plus) 2006 1:100,000 data. These reaches were attributed and placed into classes representing their biopysical setting in terms of stream size, gradient, and geology, and expected natural water temperature regime. Please see the attribute descriptions for more information on the variable thresholds and the summary taxonomy.
Categories: Data;
Types: ArcGIS REST Map Service,
ArcGIS Service Definition,
Downloadable,
Map Service;
Tags: Connecticut,
Delaware,
District of Columbia,
Hydrography,
Maine,

These vector contour lines are derived from the 3D Elevation Program using automated and semi-automated processes. They were created to support 1:24,000-scale CONUS and Hawaii, 1:25,000-scale Alaska, and 1:20,000-scale Puerto Rico / US Virgin Island topographic map products, but are also published in this GIS vector format. Contour intervals are assigned by 7.5-minute quadrangle, so this vector dataset is not visually seamless across quadrangle boundaries. The vector lines have elevation attributes (in feet above mean sea level on NAVD88), but this dataset does not carry line symbols or annotation.
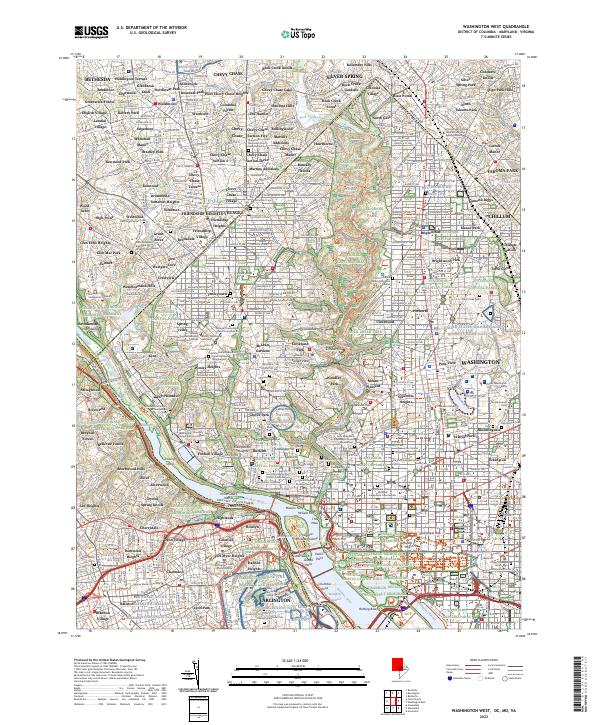
Layered geospatial PDF 7.5 Minute Quadrangle Map. Layers of geospatial data include orthoimagery, roads, grids, geographic names, elevation contours, hydrography, and other selected map features. This map is derived from GIS (geospatial information system) data. It represents a repackaging of GIS data in traditional map form, not creation of new information. The geospatial data in this map are from selected National Map data holdings and other government sources.
The U.S. Geological Survey is developing national water-use models to support water resources management in the United States. Model benefits include a nationally consistent estimation approach, greater temporal and spatial resolution of estimates, efficient and automated updates of results, and capabilities to forecast water use into the future and assess model uncertainty. This data release contains data used in a machine learning model to estimate monthly water use for communities that are supplied by public-supply water systems in the conterminous United States for 2000-2020. This data release also contains associated scripts used to produce input features as well as model output values by 12-digit hydrologic...
|

|
