Filters: Tags: District of Columbia (X)
323 results (75ms)|
Filters
Date Range
Extensions (Less)
Types (Less)
Contacts (Less)
Categories (Less)
Tag Types
|
The US Geological Survey Chesapeake Bay Watershed Land Cover Data Series, 2011 edition, (CBLCD-e11) consists of Level I Land Cover data for the years 1984, 1992, 2001, 2006 and 2011. It consists of a series of five 8-bit unsigned integer raster data files of 30 meter spatial resolution in Albers Conic Equal Area projection, NAD83 datum. The 1984 – 2006 data layers were created by aggregating most Level II Anderson classes of the USGS CBLCD Land Cover Data Series released in 2010 (Irani and Claggett, 2010).
This dataset contains watershed means of estimated percent impervious surfaces for three time periods: 1992, 2002, and 2012. Estimates are based on coefficients derived from comparing land use of the 2012 NAWQA Wall-to-wall Anthropogenic Land-use Trends (NWALT) product to the 2011 National Land Cover Database (NLCD) imperviousness, then applying those coefficients to previous years (1974-2002) of the NWALT dataset.
Categories: Data;
Types: Citation;
Tags: Chesapeake Bay,
Delaware,
District of Columbia,
James River,
Maryland,
Field spikes were prepared at 207 stream and river sites as part of the U.S. Geological Survey (USGS) National Water Quality Assessment (NAWQA) project between December, 2012, and September, 2015. At the field site, a depth-and width-integrated environmental sample was collected, and one subsample of the environmental sample was spiked with a known amount of a spike mixture. Both the spiked subsample ("spike sample") and another subsample ("environmental sample") of the original water sample were analyzed for pesticides at the USGS National Water Quality Laboratory (NWQL) by direct injection liquid chromatography with tandem mass spectrometry (LC-MS/MS), and were used to calculate the spike recovery of each analyte....

This map layer consists of federally owned or administered lands of the United States, Puerto Rico, and the U.S. Virgin Islands. For the most part, only areas of 320 acres or more are included; some smaller areas deemed to be important or significant are also included. There may be private inholdings within the boundaries of Federal lands in this map layer. Some established Federal lands which are larger than 320 acres are not included in this map layer, because their boundaries were not available from the owning or administering agency.
This dataset provides timeseries data on water quality and quantity, as collected or computed from outside sources. The format is many tables with one row per time series observation (1 tab-delimited file per site-variable combination, 1 zip file per site). This compilation of data is intended for use in estimating or interpreting metabolism. Sites were included if they met the initial criteria of having at least 100 dissolved oxygen observations and one of the accepted NWIS site types ('ST','ST-CA','ST-DCH','ST-TS', or 'SP'). This dataset is part of a larger data release of metabolism model inputs and outputs for 356 streams and rivers across the United States (https://doi.org/10.5066/F70864KX). The complete release...
The U. S. Geological Survey (USGS) makes long-term seismic hazard forecasts that are used in building codes. The hazard models usually consider only natural seismicity; non-tectonic (man-made) earthquakes are excluded because they are transitory or too small. In the past decade, however, thousands of earthquakes related to underground fluid injection have occurred in the central and eastern U.S. (CEUS), and some have caused damage. In response, the USGS is now also making short-term forecasts that account for the hazard from these induced earthquakes. A uniform earthquake catalog is assembled by combining and winnowing pre-existing source catalogs. Seismicity statistics are analyzed to develop recurrence models,...
This metadata record documents 11 comma delimited tables representing the amount of reported best management practice (BMP) implementation for the years from 1985 to 2014 at three geographic scales: county or land-river modeling segment, River Input Monitoring (RIM) station drainage areas, and the entire Chesapeake Bay Watershed (CBWS). Data originated from the Chesapeake Bay Watershed jurisdictions including Maryland, Pennsylvania, Virginia, Delaware, New York, West Virginia, and the District of Columbia. Data were reported to the Chesapeake Bay Program for an annual review of progress toward meeting nitrogen, phosphorus, and sediment reduction goals.
Geospatial data that is a derivative land cover product depicting woodland on topographic maps.

This map layer shows Indian lands of the United States. For the most part, only areas of 320 acres or more are included; some smaller areas deemed to be important or significant are also included. Federally-administered lands within a reservation are included for continuity; these may or may not be considered part of the reservation and are simply described with their feature type and the administrating Federal agency. Some established Indian lands which are larger than 320 acres are not included in this map layer because their boundaries were not available from the owning or administering agency.
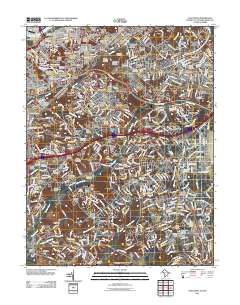
Layered GeoPDF 7.5 Minute Quadrangle Map. Layers of geospatial data include orthoimagery, roads, grids, geographic names, elevation contours, hydrography, and other selected map features.
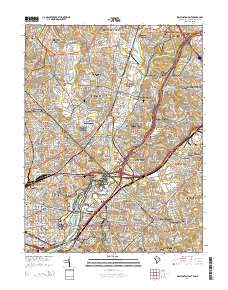
Layered GeoPDF 7.5 Minute Quadrangle Map. Layers of geospatial data include orthoimagery, roads, grids, geographic names, elevation contours, hydrography, and other selected map features.
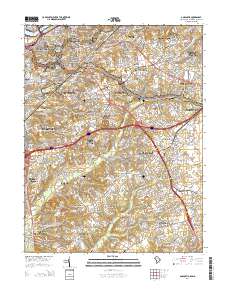
Layered GeoPDF 7.5 Minute Quadrangle Map. Layers of geospatial data include orthoimagery, roads, grids, geographic names, elevation contours, hydrography, and other selected map features.
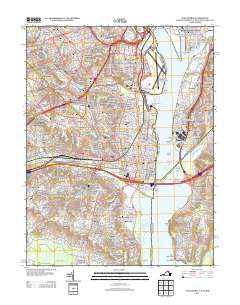
Layered GeoPDF 7.5 Minute Quadrangle Map. Layers of geospatial data include orthoimagery, roads, grids, geographic names, elevation contours, hydrography, and other selected map features.
Geospatial data includes structures and other selected map features.
Coastal communities are uniquely vulnerable to sea-level rise (SLR) and severe storms such as hurricanes. These events enhance the dispersion and concentration of natural and anthropogenic chemicals and pathogenic microorganisms that could adversely affect the health and resilience of coastal communities and ecosystems in coming years. The U.S. Geological Survey has developed the Sediment-Bound Contaminant Resiliency and Response (SCoRR) strategy to define baseline and post-event sediment-bound environmental health (EH) stressors. These data document toxicity measured by reduction of the light emission of Aliivibrio (formerly Photobacterium) fischeri and the inhibition of polymerase chain reactions caused by environmental...

The Geographic Names Information System (GNIS) is the Federal standard for geographic nomenclature. The U.S. Geological Survey developed the GNIS for the U.S. Board on Geographic Names, a Federal inter-agency body chartered by public law to maintain uniform feature name usage throughout the Government and to promulgate standard names to the public. The GNIS is the official repository of domestic geographic names data; the official vehicle for geographic names use by all departments of the Federal Government; and the source for applying geographic names to Federal electronic and printed products of all types.
The Geographic Names Information System (GNIS) is the Federal standard for geographic nomenclature. The U.S. Geological Survey developed the GNIS for the U.S. Board on Geographic Names, a Federal inter-agency body chartered by public law to maintain uniform feature name usage throughout the Government and to promulgate standard names to the public. The GNIS is the official repository of domestic geographic names data; the official vehicle for geographic names use by all departments of the Federal Government; and the source for applying geographic names to Federal electronic and printed products of all types.
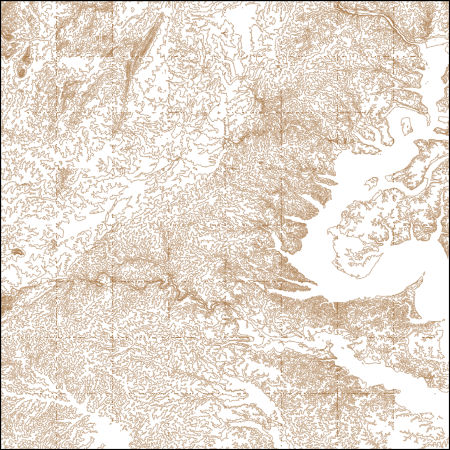
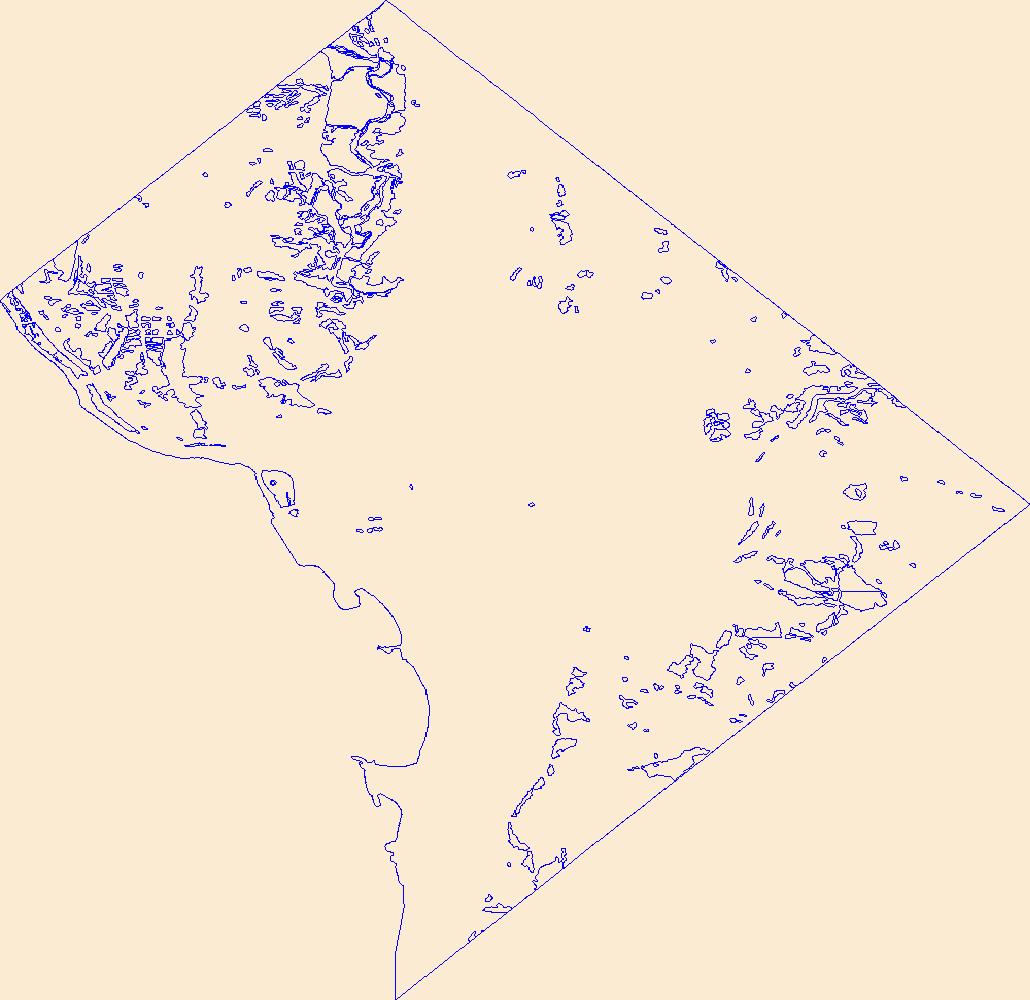
These vector contour lines are derived from the 3D Elevation Program using automated and semi-automated processes. They were created to support 1:24,000-scale CONUS and Hawaii, 1:25,000-scale Alaska, and 1:20,000-scale Puerto Rico / US Virgin Island topographic map products, but are also published in this GIS vector format. Contour intervals are assigned by 7.5-minute quadrangle, so this vector dataset is not visually seamless across quadrangle boundaries. The vector lines have elevation attributes (in feet above mean sea level on NAVD88), but this dataset does not carry line symbols or annotation.
This child item describes Python code used to estimate average yearly and monthly tourism per 1000 residents within public-supply water service areas. Increases in population due to tourism may impact amounts of water used by public-supply water systems. This data release contains model input datasets, Python code used to develop the tourism information, and output estimates of tourism. This dataset is part of a larger data release using machine learning to predict public supply water use for 12-digit hydrologic units from 2000-2020. Output from this code was used as an input feature in the public supply delivery and water use machine learning models. This page includes the following files: tourism_input_data.zip...
This child item describes a public supply delivery machine learning model that was developed to estimate public-supply deliveries. Publicly supplied water may be delivered to domestic users or to commercial, industrial, institutional, and irrigation (CII) users. This model predicts total, domestic, and CII per capita rates for public-supply water service areas within the conterminous United States for 2009-2020. This child item contains model input datasets, code used to build the delivery machine learning model, and national predictions. This dataset is part of a larger data release using machine learning to predict public-supply water use for 12-digit hydrologic units from 2000-2020. This page includes the following...
|

|
