Filters: Tags: District of Columbia (X)
323 results (28ms)|
Filters
Date Range
Extensions
Types Contacts
Categories
Tag Types
|
This child item describes Python code used to query census data from the TigerWeb Representational State Transfer (REST) services and the U.S. Census Bureau Application Programming Interface (API). These data were needed as input feature variables for a machine learning model to predict public supply water use for the conterminous United States. Census data were retrieved for public-supply water service areas, but the census data collector could be used to retrieve data for other areas of interest. This dataset is part of a larger data release using machine learning to predict public supply water use for 12-digit hydrologic units from 2000-2020. Data retrieved by the census data collector code were used as input...
This map layer shows major ports in the United States, Puerto Rico, and the U.S. Virgin Islands. A port is a city, town, or urban area with a harbor where ships load or unload. This is a revised version of the July 2012 map layer.
Categories: Data;
Types: Downloadable,
Map Service,
OGC WFS Layer,
OGC WMS Layer,
Shapefile;
Tags: Academics & scientific researchers,
Alabama,
Arizona,
Arkansas,
California,
This data set represents the extent, approximate location and type of wetlands and deepwater habitats in the United States and its Territories. These data delineate the areal extent of wetlands and surface waters as defined by Cowardin et al. (1979). Certain wetland habitats are excluded from the National mapping program because of the limitations of aerial imagery as the primary data source used to detect wetlands. These habitats include seagrasses or submerged aquatic vegetation that are found in the intertidal and subtidal zones of estuaries and near shore coastal waters. Some deepwater reef communities (coral or tuberficid worm reefs) have also been excluded from the inventory. These habitats, because of their...
Categories: Data;
Types: Map Service,
OGC WFS Layer,
OGC WMS Layer,
OGC WMS Service;
Tags: Academics & scientific researchers,
Alabama,
Alabama,
Alaska,
Arizona,
This dataset represents the connections between each nearby pair of 2080 cores for American woodcock. It is intended to highlight areas important for connecting cores and to visually represent the connections among refugia cores.
Categories: Data;
Types: Downloadable,
GeoTIFF,
Map Service,
Raster;
Tags: Connecticut,
Delaware,
District of Columbia,
Maine,
Maryland,
This dataset represents the connections between each nearby pair of 2020 cores for Blackburnian warbler. It is intended to highlight areas important for connecting cores and to visually represent the connections among cores.
Categories: Data;
Types: Downloadable,
GeoTIFF,
Map Service,
Raster;
Tags: Connecticut,
Delaware,
District of Columbia,
Maine,
Maryland,
Layers of geospatial data include contours, boundaries, land cover, hydrography, roads, transportation, geographic names, structures, and other selected map features.
Types: Citation;
Tags: 7.5 x 7.5 minute,
7_5_Min,
Alexandria County,
Arlington County,
Combined Vector,
Measures used to assess trends in the 10th, 50th, and 90th quantiles of annual peak streamflow from 1916-2015 at 2,683 U.S. Geological Survey stations and within 191 4-digit HUCs in the conterminous United States. Linear quantile regression was applied to the selected quantiles of log-transformed annual peak streamflow to represent trends for a range of flood frequencies from small, common floods to large, infrequent floods. Comparative trends in pairs of quantiles were characterized as coherent, convergent, or divergent by comparing the slopes of linear quantile regression equations.
Daily lake surface temperatures estimates for 185,549 lakes across the contiguous United States from 1980 to 2020 generated using an entity-aware long short-term memory deep learning model. In-situ measurements used for model training and evaluation are from 12,227 lakes and are included as well as daily meteorological conditions and lake properties. Median per-lake estimated error found through cross validation on lakes with in-situ surface temperature observations was 1.24 °C. The generated dataset will be beneficial for a wide range of applications including estimations of thermal habitats and the impacts of climate change on inland lakes.
To estimate changes in nitrogen, phosphorus, and sediment loads from technologies and management practices (TMPs), the Chesapeake Bay Program Partnership's CAST model was used to run scenarios with and without TMPs for years between 1985 and 2020 for the Chesapeake Bay watershed. Scenarios were run using the native model segmentation of land-river segments and downscaled to the National Hydrography Dataset (NHD) plus version 2 catchments. The land-river segment loads were disaggregated to the National Hydrography Dataset Plus, Version 2.0 using methods described in "CAST Data Input Disaggregation from County and Land-River Segment Scale to National Hydrography Dataset Plus". The estimated total nitrogen (TN), total...
This data release contains relevant datasets used in the analysis for the Chesapeake Bay stressor identification project, for which results are described in Fanelli and others (2022). For this project, two existing information sources were compiled and summarized to identify key in-stream stressors reported by the scientific literature or through regulatory assessments to be likely affecting benthic macroinvertebrate community metrics in the Chesapeake Bay region: 1) the peer reviewed multi-stressor literature, in which the effects multiple in-stream stressors on benthic macroinvertebrate community metrics are simultaneously assessed; and 2) reported causes of biological impairment as listed by state or district...
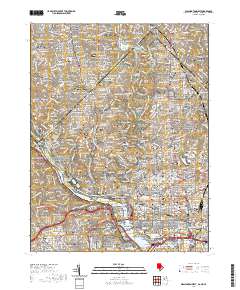
Layered geospatial PDF 7.5 Minute Quadrangle Map. Layers of geospatial data include orthoimagery, roads, grids, geographic names, elevation contours, hydrography, and other selected map features. This map is derived from GIS (geospatial information system) data. It represents a repackaging of GIS data in traditional map form, not creation of new information. The geospatial data in this map are from selected National Map data holdings and other government sources.
This dataset presents the total estimated monthly public-supply water withdrawal by 12-digit hydrologic unit code (HUC12) in the conterminous United States for 2015. Public-supply water use was estimated by spatially and temporally downscaling available data from each state. The total represents combined groundwater and surface water withdrawals for 83,178 watersheds. Public supply refers to water withdrawn by public and private water suppliers that provide water for cities, towns, rural water districts, mobile-home parks, Native American Indian reservations, and military bases. Public-supply facilities are classified under the Standard Industrial Classification (SIC) 4941 and provide water to at least 25 people...
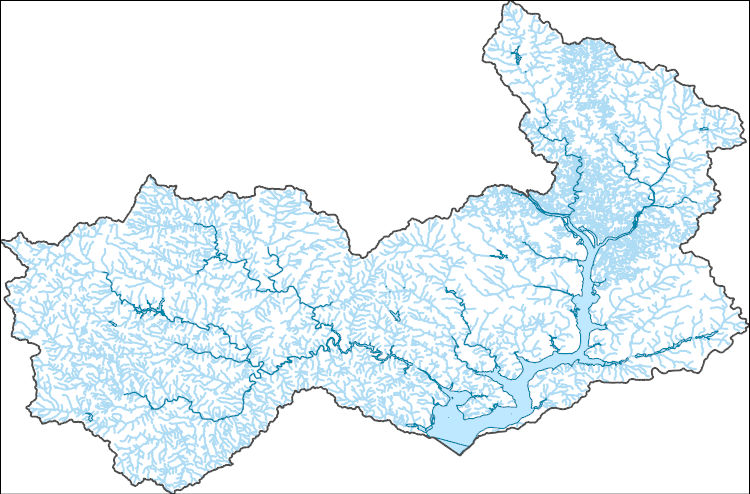
Freshwater salinization is an emerging issue for freshwater environments in the Chesapeake Bay, USA region. Salinization is often described by measurements of specific conductance (SC). This data release contains specific conductance observations collected by multiple regional agencies for streams within the Chesapeake Bay Watershed. This inventory compiles and harmonizes data from the Water Quality Portal (WQP), which is a data repository developed by the National Water Quality Monitoring Council and supported by the U.S. Environmental Protection Agency and U.S. Geological Survey, and the U.S. Geological Survey National Water Information System (NWIS). Both discrete measures of SC, which are single measures taken...
Categories: Data;
Tags: Chesapeake Bay watershed,
Delaware,
District of Columbia,
Hydrology,
Maryland,
The download for this dataset includes TNC’s full Northeastern Aquatic Habitat Classification System: stream size, stream temperature, stream gradient, stream geology, lakes and catchments. This dataset represents the results (9/30/2008) of the Northeastern Aquatic Habitat Classification System (NAHCS) GIS map for streams and rivers. This classification focused on mapping a stream habitat types across 13 northeastern states (ME, NH, VT, MA, CT, RI, NY, NJ, PA, MD, DC, DE, VA, WV). Stream and river centerlines were extracted from the USGS National Hydrography Dataset Plus (NH-Plus) 2006 1:100,000 data. These reaches were attributed and placed into classes representing their biopysical setting in terms of stream...
Categories: Data;
Types: ArcGIS REST Map Service,
ArcGIS Service Definition,
Downloadable,
Map Service;
Tags: Connecticut,
Connecticut,
Data,
Delaware,
Delaware,
The data presented here are blacklegged tick nymph densities, white-tailed deer densities, and Borrelia burgdorferi (causative agent of Lyme disease) prevalences for eight national parks in the eastern United States from 2014-2022.
The National Hydrography Dataset (NHD) is a feature-based database that interconnects and uniquely identifies the stream segments or reaches that make up the nation's surface water drainage system. NHD data was originally developed at 1:100,000-scale and exists at that scale for the whole country. This high-resolution NHD, generally developed at 1:24,000/1:12,000 scale, adds detail to the original 1:100,000-scale NHD. (Data for Alaska, Puerto Rico and the Virgin Islands was developed at high-resolution, not 1:100,000 scale.) Local resolution NHD is being developed where partners and data exist. The NHD contains reach codes for networked features, flow direction, names, and centerline representations for areal water...

This dataset, termed "GAGES II", an acronym for Geospatial Attributes of Gages for Evaluating Streamflow, version II, provides geospatial data and classifications for 9,322 stream gages maintained by the U.S. Geological Survey (USGS). It is an update to the original GAGES, which was published as a Data Paper on the journal Ecology's website (Falcone and others, 2010b) in 2010. The GAGES II dataset consists of gages which have had either 20+ complete years (not necessarily continuous) of discharge record since 1950, or are currently active, as of water year 2009, and whose watersheds lie within the United States, including Alaska, Hawaii, and Puerto Rico. Reference gages were identified based on indicators that they...
Types: Map Service,
OGC WFS Layer,
OGC WMS Layer,
OGC WMS Service;
Tags: Alabama,
Alaska,
All 50 states,
Arizona,
Arkansas,
WHISPers stands for Wildlife Health Information Sharing Partnership - event reporting system. It is a web-based repository for sharing basic information about historic and ongoing wildlife mortality (death) and morbidity (illness) events. The system possesses a searchable archive of wildlife mortality and morbidity event data that is available to the public. The information is opportunistically collected and does not reflect all the mortality events that occur in North America.
The Gap Analysis Project (GAP) Analytical Database represents a synthesis of three core datasets for the conterminous U.S. Specifically 1) the GAP/LANDFIRE National Terrestrial Ecosystems_2011; 2) the Protected Areas Database of the United States (PAD-US) 1.4; and 3) the Species Ranges and Habitat Distribution Models for all terrestrial vertebrates. This database provides a mechanism to effiiently obtain summary statistics of those for a variety of spatial extents, including US states, US counties, Landscape Conservation Cooperation Network Areas, EPA's Level III-IV Ecoregions of the United States, and Level I-III Ecoregions of North America and 12-digit (6th level) hydrologic units. Disclaimer for Approved Database...
This dataset provides input data formatted for use in estimating metabolism. The format is tables of prepared time series inputs (1 tab-delimited file per site, in 1 zip file per site). This dataset is part of a larger data release of metabolism model inputs and outputs for 356 streams and rivers across the United States (https://doi.org/10.5066/F70864KX). The complete release includes: modeled estimates of gross primary productivity, ecosystem respiration, and the gas exchange coefficient; model input data and alternative input data; model fit and diagnostic information; site catchment boundaries and site point locations; and potential predictors of metabolism such as discharge and light availability.
|

|
