Filters: Tags: Drought (X)
926 results (13ms)|
Filters
Date Range
Extensions Types
Contacts
Categories Tag Types
|

The Standardized Precipitation Index (SPI) is a probability index that can be calculated for different time periods to indicate periods of abnormal wetness or dryness. SPI is derived solely from monthly precipitation and can be compared across regions with different climates. The SPI is an index based on the probability of recording a given amount of precipitation, and the probabilities are standardized so that an index of zero indicates the median precipitation amount (half of the historical precipitation amounts are below the median, and half are above the median). This dataset shows the average 12-month SPI (in classes ranging from extremely wet to extremely dry) for the three-month forecast period indentified...

This dataset shows the predicted area of high fire potential for the current year up to the end of the forecast period as simulated by a modified version of the MC1 Dynamic General Vegetation Model (DGVM). The area of high fire potential is where PDSI and MC1-calculated values of potential fire behavior (fireline intensity for forest and shrubland and rate of spread of spread for grassland) exceed calibrated threshold values. Potential fire behavior in MC1 is estimated using National Fire Danger Rating System (NFDRS) formulas, monthly climatic (temperature, precipitation, and relative humidity) data, and fuel moisture and loading estimates. Monthly climatic data includes recorded values up to the last observed...

The MAPSS team together with long-time collaborator Chris Daly of the Spatial Climate Analysis Service is using Daly's PRISM model to produce high-resolution data grids of observed fire weather. The PRISM model produces interpolations of weather station data that are sensitive to topography, which is especially important in the complex, fire-prone terrain of the mountainous West. Input station data are gathered primarily from the National Weather Service (NWS) Cooperative Observer Program (COOP) and U.S. Department of Agriculture-Natural Resources Conservation Service (USDA-NRCS) SNOTEL networks. For mapped examples of the PRISM-generated historical weather data grids see the Spatial Climate Analysis Service's Web...
This research investigates the interannual variability of soil moisture as related to large-scale climate variability and also evaluates the spatial and temporal variability of modeled deep layer (40?140 cm) soil moisture in the Upper Colorado River Basin (UCRB). A three layers hydrological model VIC-3L (Variable Infiltration Capacity Model ? 3 layers) was used to generate soil moisture in the UCRB over a 50-year period. By using wavelet analysis, deep layer soil moisture was compared to the Palmer Drought Severity Index (PDSI), precipitation, and streamflow to determine whether deep soil moisture is an indicator of climate extremes. Wavelet and coherency analysis for the UCRB indicated a strong relationship between...
Categories: Publication;
Types: Citation,
Journal Citation;
Tags: Journal of Hydrology,
Upper Colorado River Basin,
drought,
soil moisture,
wavelet analysis

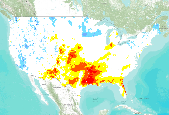
This map shows the predicted area of high fire potential for the current year up to the end of the forecast period as simulated by a modified version of the MC1 Dynamic General Vegetation Model (DGVM). Different colors indicate the level of consensus among five different MC1 simulations (i.e., one for each forecast provided by five different weather models), ranging from one of five to five of five simulations predicting high fire potential. The area of high fire potential is where PDSI and MC1-calculated values of potential fire behavior (fireline intensity for forest and shrubland and rate of spread of spread for grassland) exceed calibrated threshold values. Potential fire behavior in MC1 is estimated using...

The Palmer Drought Severity Index (PDSI) is a measure of drought derived from both precipitation and temperature. Negative (i.e., dry) values of PDSI are closely associated with a high potential for wildland fire. PDSI is based on a supply-and-demand model of soil moisture originally developed by Wayne Palmer, who published his method in the 1965 paper Meteorological Drought for the Office of Climatology of the U.S. Weather Bureau.The index has proven to be most effective in indicating long-term drought (or wetness) over a matter of several months. PDSI calculations are standardized for an individual station (or grid cell) based on the long-term variability of precipitation and temperature at that location....

The Palmer Drought Severity Index (PDSI) is a measure of drought derived from both precipitation and temperature. Negative (i.e., dry) values of PDSI are closely associated with a high potential for wildland fire. PDSI is based on a supply-and-demand model of soil moisture originally developed by Wayne Palmer, who published his method in the 1965 paper Meteorological Drought for the Office of Climatology of the U.S. Weather Bureau.The index has proven to be most effective in indicating long-term drought (or wetness) over a matter of several months. PDSI calculations are standardized for an individual station (or grid cell) based on the long-term variability of precipitation and temperature at that location....

This map shows the predicted area of high fire potential for the current year up to the end of the forecast period as simulated by a modified version of the MC1 Dynamic General Vegetation Model (DGVM). Different colors indicate the level of consensus among five different MC1 simulations (i.e., one for each forecast provided by five different weather models), ranging from one of five to five of five simulations predicting high fire potential. The area of high fire potential is where PDSI and MC1-calculated values of potential fire behavior (fireline intensity for forest and shrubland and rate of spread of spread for grassland) exceed calibrated threshold values. Potential fire behavior in MC1 is estimated using...

The Palmer Drought Severity Index (PDSI) is a measure of drought derived from both precipitation and temperature. Negative (i.e., dry) values of PDSI are closely associated with a high potential for wildland fire. PDSI is based on a supply-and-demand model of soil moisture originally developed by Wayne Palmer, who published his method in the 1965 paper Meteorological Drought for the Office of Climatology of the U.S. Weather Bureau.The index has proven to be most effective in indicating long-term drought (or wetness) over a matter of several months. PDSI calculations are standardized for an individual station (or grid cell) based on the long-term variability of precipitation and temperature at that location....

This dataset shows the predicted area of high fire potential for the current year up to the end of the forecast period as simulated by a modified version of the MC1 Dynamic General Vegetation Model (DGVM). The area of high fire potential is where PDSI and MC1-calculated values of potential fire behavior (fireline intensity for forest and shrubland and rate of spread of spread for grassland) exceed calibrated threshold values. Potential fire behavior in MC1 is estimated using National Fire Danger Rating System (NFDRS) formulas, monthly climatic (temperature, precipitation, and relative humidity) data, and fuel moisture and loading estimates. Monthly climatic data includes recorded values up to the last observed...
A severe sustained drought in the Colorado River Basin would cause economic damages throughout the Basin. An integrated hydrologic-economic-institutional model introduced here shows that consumptive water users in headwaters states are particularly vulnerable to very large shortfalls and hence large damages because their rights are effectively junior to downstream users. Chronic shortfalls to consumptive users relying on diversions in excess of rights under the Colorado River Compact are also possible. Nonconsumptive water uses (for hydropower and recreation) are severely affected during the worst drought years as instream flows are reduced and reservoirs are depleted. Damages to these uses exceeds those to consumptive...
Categories: Publication;
Types: Citation,
Journal Citation;
Tags: Journal of the American Water Resources Association,
drought,
economic impacts,
institutions,
modeling,
ABSTRACT: Samples from 107 piñon pines (Pinns edulis) at four sites were used to develop a proxy record of annual (June to June) precipitation spanning the 1226 to 2001 AD interval for the Uinta Basin Watershed of northeastern Utah. The reconstruction reveals significant precipitation variability at interannual to decadal scales. Single-year dry events before the instrumental period tended to be more severe than those after 1900. In general, decadal scale dry events were longer and more severe prior to 1900. In particular, dry events in the late 13th, 16th, and 18th Centuries surpass the magnitude and duration of droughts seen in the Uinta Basin after 1900. The last four decades of the 20th Century also represent...
Categories: Publication;
Types: Citation;
Tags: Tree r,
drought,
paleohydrology,
time-series analysis
Evidence from woodrat middens and tree rings at Dutch John Mountain (DJM) in northeastern Utah reveal spatiotemporal patterns of pinyon pine (Pinus edulis Engelm.) colonization and expansion in the past millennium. The DJM population, a northern outpost of pinyon, was established by long-distance dispersal (approximately 40 km). Growth of this isolate was markedly episodic and tracked multidecadal variability in precipitation. Initial colonization occurred by AD 1246, but expansion was forestalled by catastrophic drought (1250-1288), which we speculate produced extensive mortality of Utah Juniper (Juniperus osteosperma (Torr.) Little), the dominant tree at DJM for the previous approximately 8700 years. Pinyon then...
Categories: Publication;
Types: Citation,
Journal Citation;
Tags: Eco Soc America,
Ecology,
drought,
founder event,
paleoecology,
Researchers representing each of the Colorado River Basin states as well as the Secretary of the Interior were presented with an interactive computer simulation of a progressively increasing drought and were given the collective opportunity to change the ways in which basin-wide and within-state water management were conducted. The purpose of this ?gaming? exercise was to identify rules for managing the Colorado River which are effective in preventing drought-caused damages to basin water users. This water management game was conducted three times, varying the collective choice roles for management of the river yet staying substantially within the current institution for management of the Colorado River known as...
Categories: Publication;
Types: Citation,
Journal Citation;
Tags: Colorado River Basin,
Journal of the American Water Resources Association,
drought,
gaming,
institutions,
The MAPSS team together with long-time collaborator Chris Daly of the Spatial Climate Analysis Service is using Daly's PRISM model to produce high-resolution data grids of observed fire weather. The PRISM model produces interpolations of weather station data that are sensitive to topography, which is especially important in the complex, fire-prone terrain of the mountainous West. Input station data are gathered primarily from the National Weather Service (NWS) Cooperative Observer Program (COOP) and U.S. Department of Agriculture-Natural Resources Conservation Service (USDA-NRCS) SNOTEL networks. For mapped examples of the PRISM-generated historical weather data grids see the Spatial Climate Analysis Service's Web...

The Palmer Drought Severity Index (PDSI) is a measure of drought derived from both precipitation and temperature. Negative (i.e., dry) values of PDSI are closely associated with a high potential for wildland fire. PDSI is based on a supply-and-demand model of soil moisture originally developed by Wayne Palmer, who published his method in the 1965 paper Meteorological Drought for the Office of Climatology of the U.S. Weather Bureau.The index has proven to be most effective in indicating long-term drought (or wetness) over a matter of several months. PDSI calculations are standardized for an individual station (or grid cell) based on the long-term variability of precipitation and temperature at that location....

The Standardized Precipitation Index (SPI) is a probability index that can be calculated for different time periods to indicate periods of abnormal wetness or dryness. SPI is derived solely from monthly precipitation and can be compared across regions with different climates. The SPI is an index based on the probability of recording a given amount of precipitation, and the probabilities are standardized so that an index of zero indicates the median precipitation amount (half of the historical precipitation amounts are below the median, and half are above the median). This dataset shows the average 12-month SPI (in classes ranging from extremely wet to extremely dry) for the three-month forecast period indentified...

The Standardized Precipitation Index (SPI) is a probability index that can be calculated for different time periods to indicate periods of abnormal wetness or dryness. SPI is derived solely from monthly precipitation and can be compared across regions with different climates. The SPI is an index based on the probability of recording a given amount of precipitation, and the probabilities are standardized so that an index of zero indicates the median precipitation amount (half of the historical precipitation amounts are below the median, and half are above the median). This dataset shows the average 12-month SPI (in classes ranging from extremely wet to extremely dry) for the three-month forecast period indentified...

The Standardized Precipitation Index (SPI) is a probability index that can be calculated for different time periods to indicate periods of abnormal wetness or dryness. SPI is derived solely from monthly precipitation and can be compared across regions with different climates. The SPI is an index based on the probability of recording a given amount of precipitation, and the probabilities are standardized so that an index of zero indicates the median precipitation amount (half of the historical precipitation amounts are below the median, and half are above the median). This dataset shows the average 12-month SPI (in classes ranging from extremely wet to extremely dry) for the three-month forecast period indentified...

This dataset shows the predicted area of high fire potential for the current year up to the end of the forecast period as simulated by a modified version of the MC1 Dynamic General Vegetation Model (DGVM). The area of high fire potential is where PDSI and MC1-calculated values of potential fire behavior (fireline intensity for forest and shrubland and rate of spread of spread for grassland) exceed calibrated threshold values. Potential fire behavior in MC1 is estimated using National Fire Danger Rating System (NFDRS) formulas, monthly climatic (temperature, precipitation, and relative humidity) data, and fuel moisture and loading estimates. Monthly climatic data includes recorded values up to the last observed...
|

|
