Filters: Tags: EMERSON (X)
54 results (26ms)|
Filters
Date Range
Extensions Types
Contacts
Categories Tag Types Tag Schemes |
This data set contains imagery from the National Agriculture Imagery Program (NAIP). The NAIP program is administered by USDA FSA and has been established to support two main FSA strategic goals centered on agricultural production. These are, increase stewardship of America's natural resources while enhancing the environment, and to ensure commodities are procured and distributed effectively and efficiently to increase food security. The NAIP program supports these goals by acquiring and providing ortho imagery that has been collected during the agricultural growing season in the U.S. The NAIP ortho imagery is tailored to meet FSA requirements and is a fundamental tool used to support FSA farm and conservation programs....
Types: Citation;
Tags: 22027,
3.75 x 3.75 minute,
3309363,
Aerial Compliance,
CLAIBORNE PARISH LA FSA,
This location is part of the Arizona Mineral Industry Location System (AzMILS), an inventory of mineral occurences, prospects and mine locations in Arizona. Mohave122G is located in T23N R18W Sec 11 NW in the Chloride - 7.5 Min quad. This collection consists of various reports, maps, records and related materials acquired by the Arizona Department of Mines and Mineral Resources regarding mining properties in Arizona. Information was obtained by various means, including the property owners, exploration companies, consultants, verbal interviews, field visits, newspapers and publications. Some sections may be redacted for copyright. Please see the access statement.
The dataset contains estimates for total phosphorus flux from wastewater treatment plants that discharge to surface water within the Red River of the North Basin in the United States and subbasins. Shapefiles defining the subbasins are available as part of the same data release in which these data are published. Estimates of wastewater treatment plant total phosphorus flux (or load) were calculated by Tammy Ivanhnenko for the years 1978, 1980, 1982, 1984, 1986, 1988, 1990, 1992, 1996, 2000, 2004, 2008, and 2012. Flux estimates were based on the average discharge from the wastewater treatment plants and treatment level, both reported as part of the U.S. Environmental Protection Agency's Clean Watershed Needs Survey,...
This data set contains imagery from the National Agriculture Imagery Program (NAIP). The NAIP program is administered by USDA FSA and has been established to support two main FSA strategic goals centered on agricultural production. These are, increase stewardship of America's natural resources while enhancing the environment, and to ensure commodities are procured and distributed effectively and efficiently to increase food security. The NAIP program supports these goals by acquiring and providing ortho imagery that has been collected during the agricultural growing season in the U.S. The NAIP ortho imagery is tailored to meet FSA requirements and is a fundamental tool used to support FSA farm and conservation programs....
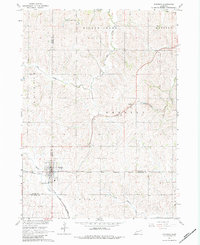
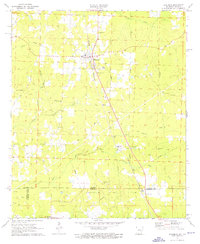
USGS Historical Quadrangle in GeoPDF.
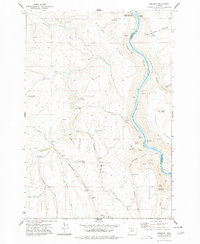
USGS Historical Quadrangle in GeoPDF.
This data shows select streamgage locations throughout the Red River of the North Basin upstream of Emerson, Manitoba, and basin outlines for eight subbasins..
Categories: Data;
Types: Citation,
Downloadable,
Map Service,
OGC WFS Layer,
OGC WMS Layer,
Shapefile;
Tags: Crookston,
Emerson,
Fargo,
Halstad,
Kindred,
This data set contains imagery from the National Agriculture Imagery Program (NAIP). The NAIP program is administered by USDA FSA and has been established to support two main FSA strategic goals centered on agricultural production. These are increase stewardship of America's natural resources while enhancing the environment, and to ensure commodities are procured and distributed effectively and efficiently to increase food security. The NAIP program supports these goals by acquiring and providing ortho imagery that has been collected during the agricultural growing season in the U.S. The NAIP ortho imagery is tailored to meet FSA requirements and is a fundamental tool used to support FSA farm and conservation programs....
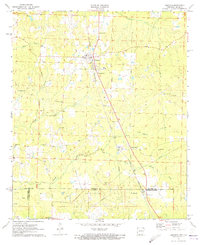
USGS Historical Quadrangle in GeoPDF.
This data set contains imagery from the National Agriculture Imagery Program (NAIP). The NAIP program is administered by USDA FSA and has been established to support two main FSA strategic goals centered on agricultural production. These are, increase stewardship of America's natural resources while enhancing the environment, and to ensure commodities are procured and distributed effectively and efficiently to increase food security. The NAIP program supports these goals by acquiring and providing ortho imagery that has been collected during the agricultural growing season in the U.S. The NAIP ortho imagery is tailored to meet FSA requirements and is a fundamental tool used to support FSA farm and conservation programs....
This data set contains imagery from the National Agriculture Imagery Program (NAIP). The NAIP program is administered by USDA FSA and has been established to support two main FSA strategic goals centered on agricultural production. These are, increase stewardship of America's natural resources while enhancing the environment, and to ensure commodities are procured and distributed effectively and efficiently to increase food security. The NAIP program supports these goals by acquiring and providing ortho imagery that has been collected during the agricultural growing season in the U.S. The NAIP ortho imagery is tailored to meet FSA requirements and is a fundamental tool used to support FSA farm and conservation programs....
This data set contains imagery from the National Agriculture Imagery Program (NAIP). The NAIP program is administered by USDA FSA and has been established to support two main FSA strategic goals centered on agricultural production. These are increase stewardship of America's natural resources while enhancing the environment, and to ensure commodities are procured and distributed effectively and efficiently to increase food security. The NAIP program supports these goals by acquiring and providing ortho imagery that has been collected during the agricultural growing season in the U.S. The NAIP ortho imagery is tailored to meet FSA requirements and is a fundamental tool used to support FSA farm and conservation programs....
This data set contains imagery from the National Agriculture Imagery Program (NAIP). The NAIP program is administered by USDA FSA and has been established to support two main FSA strategic goals centered on agricultural production. These are, increase stewardship of America's natural resources while enhancing the environment, and to ensure commodities are procured and distributed effectively and efficiently to increase food security. The NAIP program supports these goals by acquiring and providing ortho imagery that has been collected during the agricultural growing season in the U.S. The NAIP ortho imagery is tailored to meet FSA requirements and is a fundamental tool used to support FSA farm and conservation programs....
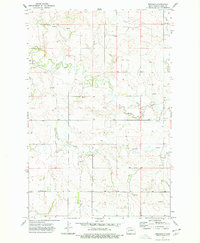
USGS Historical Quadrangle in GeoPDF.
This data set contains imagery from the National Agriculture Imagery Program (NAIP). The NAIP program is administered by USDA FSA and has been established to support two main FSA strategic goals centered on agricultural production. These are increase stewardship of America's natural resources while enhancing the environment, and to ensure commodities are procured and distributed effectively and efficiently to increase food security. The NAIP program supports these goals by acquiring and providing ortho imagery that has been collected during the agricultural growing season in the U.S. The NAIP ortho imagery is tailored to meet FSA requirements and is a fundamental tool used to support FSA farm and conservation programs....
This data set contains imagery from the National Agriculture Imagery Program (NAIP). The NAIP program is administered by USDA FSA and has been established to support two main FSA strategic goals centered on agricultural production. These are, increase stewardship of America's natural resources while enhancing the environment, and to ensure commodities are procured and distributed effectively and efficiently to increase food security. The NAIP program supports these goals by acquiring and providing ortho imagery that has been collected during the agricultural growing season in the U.S. The NAIP ortho imagery is tailored to meet FSA requirements and is a fundamental tool used to support FSA farm and conservation programs....
USGS Historical Quadrangle in GeoPDF.
Core Research Center, core B584, from well operated by ARCO OIL & GASRaw Properties from download, web scrape, MapServer, and Macrostrat API{"Lib Num": "B584", "API Num": "2503321071", "Operator": "ARCO OIL & GAS", "Well Name": "1-32 SALZGEBER", "Field": "WILDCAT", "State": "MT", "County": "GARFIELD", "Type": "SLABBED", "Photos": "F", "Thin Sec": "F", "Analysis": "F", "Latitude": "47.012959", "Longitude": "-107.320789", "coordinates_geohash": "c87emy7qk6g8", "Source": "FROM STATE RECORDS", "Security Flag": "NO SPECIAL RESTRICTIONS", "crc_collection_name": "core", "sb_parent_id": "4f4e49dae4b07f02db5e0486", "intervals": [{"Formation": "CHARLES /SALT/", "Age": "MISS", "Min Depth": "6385", "Max Depth": "6459"}, {"Formation":...
The dataset contains estimates of annual flow and annual flux in kilograms for six sites in the Red River of the North Basin (identified as basin 1, 2, 3, 4, 5, and 8). The shape files that are part of this data release document the basins and the streamgage locations are also provided in an associated shape file.
This data set contains imagery from the National Agriculture Imagery Program (NAIP). The NAIP program is administered by USDA FSA and has been established to support two main FSA strategic goals centered on agricultural production. These are, increase stewardship of America's natural resources while enhancing the environment, and to ensure commodities are procured and distributed effectively and efficiently to increase food security. The NAIP program supports these goals by acquiring and providing ortho imagery that has been collected during the agricultural growing season in the U.S. The NAIP ortho imagery is tailored to meet FSA requirements and is a fundamental tool used to support FSA farm and conservation programs....
|

|
