Filters: Tags: Ecoregion (X)
323 results (53ms)|
Filters
Date Range
Extensions
Types
Contacts
Categories Tag Types
|
Grasslands of the Sky Islands region once covered over 13 million acres in southeastern Arizona and adjacent portions of New Mexico, Sonora, and Chihuahua. Attempts to evaluate current ecological conditions suggest that approximately two thirds of these remain as intact or restorable grassland habitat. These grasslands provide watershed services such as flood control and aquifer recharge across the region, and continue to support dozens of species of concern. Prioritizing conservation interventions for these remaining grassland blocks has been challenging. Reliable data on condition and conservation value of grasslands in the region have not been systematically summarized. State and national boundaries further complicate...
Categories: Publication;
Types: Citation,
Map Service,
OGC WFS Layer,
OGC WMS Layer,
OGC WMS Service;
Tags: Chihuahuan Desert,
English,
Madrean,
Mexico,
US,
Renewables in the Mojave Desert This map shows the result of an analysis to characterize the distribution of conservation values across the Mojave Desert Ecoregion. Solar Energy Development in the Western Mojave Desert (July 2012) This assessment identifies areas in the West Mojave Desert where human activities have degraded the land’s conservation value, making them potentially low impact locations for solar development. Authors also describe a comprehensive mitigation program that aims to produce a net improvement to the conservation status of species and habitats in the West Mojave Desert. Publication: An Approach to Enhance the Conservation-Compatibility of Solar Energy Development (January 2012) Mojave...
The Pacific Southwest Region has geospatial datasets available for download from this website. These datasets are zipped personal or file geodatabases* created using ESRI ArcGis 10.0 software. Additional descriptive information as well as data steward contact information, for each geodatabase, can be found under the metadata link. These metadata files meet the Federal Geospatial Data Committee standards for structure and content.
Types: Map Service,
OGC WFS Layer,
OGC WMS Layer,
OGC WMS Service;
Tags: California,
GIS dataset,
cultural,
ecoregion,
erosion,
Our mission is to develop and maintain a cost-effective, central information source and inventory of the locations, biology, and status of all threatened, endangered, rare, and at-risk plants and animals in Nevada. We use the best available biological data to continually evaluate conservation priorities for over 700 native animals, plants, and vegetation types, focusing on those that are at greatest risk of extinction or serious decline. As a non-regulatory, independent resource for scientifically objective data, environmental review, and technical assistance and expertise, we support the needs of diverse planning, conservation management, research, education, and economic development activities in Nevada. The...
Types: Map Service,
OGC WFS Layer,
OGC WMS Layer,
OGC WMS Service;
Tags: English,
GIS,
Mojave Desert,
US,
amphibian,
EAU BC is a hierarchical classification of BC's freshwater ecosystems. It is a spatially explicit classification designed to aid in the management and conservation of BC freshwater ecosystems and their associated biodiversity. EAU BC quantifies the interplay between freshwater species distribution and their ecosystem physical habitat, and environmental processes. It defines what is currently known about freshwater ecosystems and their abundance and distribution across the Province. It is packaged as a database and accompanying geographic information system (GIS) that enables the classification and its underlying data to be queried and viewed at multiple spatial scales. Available EAUBC GIS data include EAUBC Freshwater...
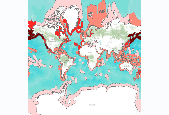
Number of globally threatened marine mammal species, by marine ecoregion. Using the online IUCN resource, the threatened species for each ecoregion were filtered for marine species only. Threatened species refer to those listed by IUCN Red List as Vulnerable, Endangered, or Critically Endangered (www.redlist.org). We downloaded the digital GIS data and summarized it by marine ecoregion to result in the number of threatened species per marine ecoregion. These data were derived by The Nature Conservancy, and were displayed in a map published in The Atlas of Global Conservation (Hoekstra et al., University of California Press, 2010). More information at http://nature.org/atlas. Data derived from: International Union...
Ecoregions are based on perceived patterns of a combination of causal and integrative factors including land use, land surface form, potential natural vegetation, and soils (Omernik, 1987).
Categories: Data;
Types: Downloadable,
Map Service,
OGC WFS Layer,
OGC WMS Layer,
Shapefile;
Tags: Aquatic,
Conterminous,
Ecoregion,
Ecoregions,
Omernik,

Change in nitrogen flow to the coast since pre-industrial times, by marine ecoregion. The map shows the estimated change in coastal discharge of dissolved inorganic nitrogen (DIN) between preindustrial and contemporary times by marine ecoregion. We calculated this change using data from Green et al. (2005), which was developed using land surface runoff models that included agriculture, livestock, human sewage, and atmospheric deposition sources of DIN. The original spatial data set assigned discharge values to coastal pixels, and we summed the value of pixels within each ecoregion for each time period. We then calculated ecoregional values by subtracting preindustrial sums from contemporary values. These data...

Proportion of coral bleaching events that were high impact, by marine ecoregion. Data on coral bleaching is derived from ReefBase and represents bleaching from a single year (1998). This was the worst bleaching event on record, linked to an El Niño year. It was also very well monitored, partly because of its unprecedented nature. Bleaching has remained widespread since that time in locations around the world. The data was generously provided by Jamie Oliver from a subset that was prepared for another publication (Oliver et al. 2008), and we have only made minor corrections to errors for the Seychelles in this data set. Bleaching reports in ReefBase were derived from a broad range of sources, but each has been assigned...
This dataset depicts the current predicted distribution of major invasive riparian vegetation in Utah and the Colorado Plateau Ecoregion.Invasive classes were extracted from multiple datasets and then combined into a single raster dataset. A cell value of 1 was assigned where invasives were present and a value of 0 was assigned where they were absent .This invasive species composite (Upland, Riparian, Uncharacteristic Exotic Vegetation) was created from:1) LANDFIRE 120 EVT, 2180: Introduced Riparian Vegetation2) NatureServe Landcover, 8480: Introduced Riparian Vegetation3) Tamarisk Coalition polygons, tamarisk on the Arkansas and Colorado Rivers (NIISS.org)4) Tamarisk 1965 line features (http://www.tamariskmap.org)A...
Southwest reGAP modeled distribution of Peregrine Falcon in the Colorado Plateau ecoregion, USA This dataset was obtained by the Conservation Biology Institute without standard metadata. Additional information is available directly from the Southwest Regional Gap Analysis Project webpage (http://fws-nmcfwru.nmsu.edu/swregap/HabitatModels/default.htm). Some information was collected from that site and presented in this metadata record. A key task was the development of seamless animal-habitat models for all terrestrial vertebrate species for the region. Through coordination from the U.S. Geological Survey's Gap Analysis Program (GAP) and the collaborative efforts of participating state institutions, 819 seamless...
This dataset depicts the current predicted distribution of Northern Leatherside Chub across the state of Utah, based on overlap with Natural Heritage Program Element occurrence data.
This file is a feature class representing UCS_COP_TI_RU_1KM_Poly_Densities_Completed_Run
Raster dataset (30m resolution mask containing only "1" values) matching the 1 km resolution reporting units grid created for the State of Utah.This dataset was used in the Utah-Colorado Plateau REA Stepdown terrestrial intactness analysis for summarizing raster input data to 1 km reporting units.
This file is a feature class representing Utah_RU_1KM_Poly
This file is a feature class representing UCS_COP_TI_RU_1KM_Poly_Densities
This dataset provides an estimate of aquatic intactness (i.e. condition or integrity) across the Woundfin Status's potential distribution. Current aquatic intactness estimates are based on the extent to which human impacts such as water demand, agriculture, urban development, natural resource extraction, dams, diversions, and alterations have disrupted the hydrology, water quality, and habitat quality of aquatic systems across the state of Utah and the Colorado Plateau. Aquatic intactness values will be high in areas where these impacts are low.This HUC6 (12-Digit NHD Hydrologic Unit Code) resolution dataset was created for the Colorado Plateau REA stepdown analysis using the open-source logic modeling framework...
This dataset represents the estimated current distribution of Bonneville Cutthroat Trout across Utah and the the Colorado Plateau Ecoregion, based on Trout Unlimited's Conservation Success Index (CSI) data.Note, data were not available for the southeastern corner of the study site; please be aware of this gap in coverage. Conservation Success Index:Trout Unlimited developed the Conservation Success Index (CSI) in order to become more strategic and effective in our conservation efforts. Using the CSI, we can quantify and map the conservation status of all native coldwater fishes so that comparisons of existing condition, threats, future security, and management opportunities can be made across watersheds, river basins,...
This dataset provides an estimate of aquatic intactness (i.e. condition or integrity) across the Bonytail Chub's potential distribution. Current aquatic intactness estimates are based on the extent to which human impacts such as water demand, agriculture, urban development, natural resource extraction, dams, diversions, and alterations have disrupted the hydrology, water quality, and habitat quality of aquatic systems across the state of Utah and the Colorado Plateau. Aquatic intactness values will be high in areas where these impacts are low.This HUC6 (12-Digit NHD Hydrologic Unit Code) resolution dataset was created for the Colorado Plateau REA stepdown analysis using the open-source logic modeling framework Environmental...
This dataset provides an estimate of aquatic intactness (i.e. condition or integrity) across the Wild Nonnative Trout's potential distribution. Current aquatic intactness estimates are based on the extent to which human impacts such as water demand, agriculture, urban development, natural resource extraction, dams, diversions, and alterations have disrupted the hydrology, water quality, and habitat quality of aquatic systems across the state of Utah and the Colorado Plateau. Aquatic intactness values will be high in areas where these impacts are low.This HUC6 (12-Digit NHD Hydrologic Unit Code) resolution dataset was created for the Colorado Plateau REA stepdown analysis using the open-source logic modeling framework...
|

|
