Filters: Tags: Ecoregions (X) > partyWithName: TNC GIS Staff (X)
38 results (21ms)|
Filters
Date Range
Tag Schemes |
Number of amphibian species, by freshwater ecoregion. We calculated the number of amphibian species per freshwater ecoregion using species range maps of the Global Amphibian Assessment (GAA, www.iucnredlist.org/amphibians) (IUCN et al. 2006). The 2006 GAA assessed 5,918 amphibian species and provided distribution maps for 5,640 of those species. When a range overlapped several ecoregions, we counted species as present in all those ecoregions that had part of the range. This may have resulted in an overestimate of species numbers in some ecoregions, especially those that are long and narrow in shape. This is particularly true for the Amazonas High Andes ecoregion (312), where the mountain range has been used as...
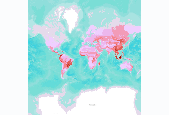
Number of globally threatened animals, by terrestrial ecoregion. We compiled a vertebrate species list for each ecoregion from WWF’s WildFinder database (WWF 2006). This list was then compared against the IUCN Red List of Threatened Species (2008) to determine the number of species per ecoregion that are threatened. Threatened species are those listed by IUCN Red List as Vulnerable, Endangered, or Critically Endangered (www.redlist.org). These data were derived by The Nature Conservancy, and were displayed in a map published in The Atlas of Global Conservation (Hoekstra et al., University of California Press, 2010). More information at http://nature.org/atlas. Data derived from: World Wildlife Fund (WWF). 2006....

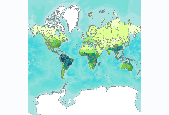
Number of mammal species, by terrestrial ecoregion. We compiled data on terrestrial mammals by querying the WWF WildFinder database for species occurrences by ecoregion. The WWF WildFinder database is a spatially explicit online database of vertebrate species occurrences by ecoregion. These data were displayed in a map published in The Atlas of Global Conservation (Hoekstra et al., University of California Press, 2010). More information at http://nature.org/atlas.

Number of freshwater fish species, by freshwater ecoregion. The map of freshwater fish species richness—the number of species present in each ecoregion—was generated from a variety of sources by Abell et al. (2008). Only species using freshwater for at least a portion of their life cycles, as identified using the habitat assignments in FishBase, are included. For the United States, NatureServe provided presence/absence data for individual species, coded to eight-digit hydrologic unit codes (HUCs); these HUC occurrences were then translated into ecoregions, and the data were manually cleaned of erroneous occurrences derived from species introductions and problematic records. For all other ecoregions, species lists...

Human population density in 2000, by terrestrial ecoregion. We summarized human population density by ecoregion using the Gridded Population of the World database and projections for 2015 (CIESIN et al. 2005). The mean for each ecoregion was extracted using a zonal statistics algorithm. These data were derived by The Nature Conservancy, and were displayed in a map published in The Atlas of Global Conservation (Hoekstra et al., University of California Press, 2010). More information at http://nature.org/atlas. Data derived from: Center for International Earth Science Information Network (CIESIN), Columbia University; and Centro Internacional de Agricultura Tropical (CIAT). 2005. Gridded Population of the World...

Percent of ecoregion area covered with desert and aridland habitat. We derived the aridlands map by first developing a raster-based mask of arid climates from the Köppen-Geiger climate classification (Kottek et al. 2006) using ArcInfo GIS software. We applied the mask to the GLC 2000 global land cover, and then extracted sparse vegetation classes. For example, pockets of forested land occurring within Köppen-Geiger arid climate regions were excluded. Areas of human habitation and infrastructure were also removed from the map, leaving only natural desert lands. Finally, we applied a zonal sum procedure to the raster map to calculate the percentage of arid land per ecoregion. These data were derived by The Nature...

Number of migratory fish species, by freshwater ecoregion. We derived the map of long-distance migrant (LDM) fish—the number of LDM species per ecoregion—from published literature, online databases (NatureServe), and expert inquiries. Potadromous, anadromous, amphidromous, and catadromous fish species were judged to be LDMs if they made regular journeys (i.e., for breeding, dispersal, feeding) of at least a hundred kilometers or more in freshwater. These species were then assigned to ecoregions based on the fish species lists database from Abell et al. (2008). Although we used many resources, two key data sources for the map were the following: Carolsfeld, J., B. Harvey, C. Ross, and A. Baer, eds. 2003. Migratory...

Percent of ecoregion area covered with forest habitat. We derived the forest map from forest and woodland classes of the Global Land Cover 2000 data set (JRC 2003) with areas of human habitation and infrastructure from the Global Rural-Urban Mapping Project database (CIESIN et al. 2004) removed. We applied a zonal sum procedure to those data to show the amount of forest by ecoregion. These data were derived by The Nature Conservancy, and were displayed in a map published in The Atlas of Global Conservation (Hoekstra et al., University of California Press, 2010). More information at http://nature.org/atlas. Data derived from: Center for International Earth Science Information Network (CIESIN), International Food...

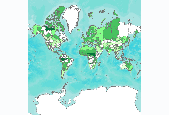
Percent land area formally protected, by terrestrial ecoregion. We derived estimates of protected area coverage from the World Database of Protected Areas (WDPA, UNEP/IUCN 2007) with supplements for the United States (CBI 2006) and Australia (CAPAD 2006). The WDPA is the most comprehensive global catalog of protected areas and includes data about their sizes, locations, and IUCN classifications of management designation. The WDPA was assembled by a broad alliance of organizations that aimed to maintain a freely available, accurate, and current database that is accepted as a global standard by all stakeholders. The distribution of all protected areas was mapped in a Geographic Information System and then summarized...

Accessibility of natural habitats to humans, by terrestrial ecoregion. The human accessibility map provides an index of the level of effort it would take for a human on foot to access any given square kilometer of nonconverted land from existing infrastructure. We calculated human accessibility from a one-square-kilometer spatial grid of the terrestrial world consisting of a cost surface where the value of each cell was derived from topographic slope, vegetation type, and vegetation density. We developed a second matching spatial grid of infrastructure, depicting roads, railroads, navigable rivers, cities, and towns. Then we calculated a least cost path from each noninfrastructure grid cell to infrastructure grid...

Number of harmful species that have invaded freshwater habitats, by freshwater ecoregion. The occurrence and ecological impact for freshwater invasive species were compiled in a geographically referenced database according to the methods of Molnar et al. (2008). Information about 550 species was systematically collected from a wide variety of global, regional, national, and subnational data sources. Non-native distributions were documented by freshwater ecoregion. The threat of each species to native biodiversity was scored using the following categories: 4, disrupts entire ecosystem processes with wider abiotic influences; 3, disrupts multiple species, some wider ecosystem function, and/or keystone species or...

Percent of ecoregion area that is arable and not yet converted. We developed the map of arable land not yet converted to agriculture from data provided by Fischer et al. (2002). Our map was produced by modeling the moderate- to high-yielding climate-soil envelopes for nine major world crops and projecting those areas geographically in regions that are not classified as urban or agricultural by JRC (2003). It represented rain-fed agriculture only, so the area of arable land is likely underestimated. It also does not account for changing future demands for irrigated agriculture that are driven by national policy and finance. These data were derived by The Nature Conservancy, and were displayed in a map published...

Dominant type of groundwater aquifer, by freshwater ecoregion. We derived the dominant groundwater features from the Groundwater Resources of the World data set, a product of the World-wide Hydrogeological Mapping and Assessment Programme (WHYMAP) (Struckmeir and Richts 2007). The WHYMAP Groundwater feature containing the largest surface area within an ecoregion was deemed the dominant feature. Groundwater classes are equivalent to classes stated in the WHYMAP data set. These data were derived by The Nature Conservancy, and were displayed in a map published in The Atlas of Global Conservation (Hoekstra et al., University of California Press, 2010). More information at http://nature.org/atlas. Data derived from:...
Area of wetlands in each freshwater ecoregion protected under Ramsar Convention. We derived the area of wetlands of international importance protected under the Ramsar Convention in each freshwater ecoregion from a subset of areas included in the World Database on Protected Areas (WDPA) compiled by the UNEP World Conservation Monitoring Centre (UNEP/IUCN 2007). All Ramsar sites in the database were included, except those known to be purely marine in extent, as indicated by the Marine Classes noted as subtidal in the WDPA. Intertidal marine Ramsar sites, however, are included in the analysis because the sites may include both brackish and fresh-waters. Area attributes for those Ramsar sites within the WDPA that...

Number of freshwater bird species, by freshwater ecoregion. Freshwater obligate birds include those species that need freshwater habitats for breeding (e.g., ducks, herons) or feeding (i.e., birds that depend almost exclusively on food found in freshwater habitats, such as freshwater fish, mollusks, and crustaceans). In all, 815 bird species were found to meet this criterion, with almost all bird families represented. We mapped freshwater bird species to freshwater ecoregions with the following procedures: for North and South America, NatureServe GIS data were summarized by freshwater ecoregion; for Africa, distribution maps presented in Birds of Africa (Brown et al. 1982–1997) were used to assign species to freshwater...

Percent of each terrestrial ecoregion's natural habitat that has been converted by humans. The data on the amount of habitat lost was derived from the Global Land Cover 2000 (JRC 2003), which is based on satellite imagery; the Global Rural-Urban Mapping Project (CIESIN et al. 2004); and a global coverage of roads and railroads compiled from ESRI Digital Chart of the World. While the data tell us how much land has been converted from a natural state to a human-altered state for 2000, it does not tell us about any specific type of habitat that has been lost, what it was converted to, how long ago it was converted, or the extent to which the human land use still supports some biodiversity. Because the satellite-derived...

Number of snake and lizard species, by terrestrial ecoregion. We compiled data on terrestrial lizards and snakes by querying the WWF WildFinder database for species occurrences by ecoregion of the following taxonomic groups: Sauria, Serpentes, Amphisbaenia, and Rhynchocephalia. The WWF WildFinder database is a spatially explicit online database of vertebrate species occurrences by ecoregion. These data were displayed in a map published in The Atlas of Global Conservation (Hoekstra et al., University of California Press, 2010). More information at http://nature.org/atlas.

Number of globally threatened freshwater mammal, bird, and crocodilian species, by freshwater ecoregion. We generated the map of number of freshwater mammals, birds, and crocodilian species per ecoregion that are threatened with extinction from multiple sources, including species range maps, as well as geographic range descriptions from literature and online sources (our primary sources are listed below). Threatened species refer to those listed by IUCN Red List as Vulnerable, Endangered, or Critically Endangered (www.redlist.org). We added together the numbers of threatened species for each of the taxonomic groups by ecoregion. When species range maps were used and a range overlapped several ecoregions, species...

Degree of water stress by ecoregion - where human demand for water outstrips natural supply. These data were derived by The Nature Conservancy, and were displayed in a map published in The Atlas of Global Conservation (Hoekstra et al., University of California Press, 2010). More information at http://nature.org/atlas. The water stress indicator calculation is based on a global water balance model, coupled with estimates of water use by sector (agriculture, domestic, and industrial). These data were derived from the WaterGAP model developed by the University of Kassel in Germany (Alcamo et al. 2003; Döll et al. 2003). The WaterGAP model combined precipitation, temperature, the location of reservoirs and lakes,...
Tags: ecoregions

Number of freshwater endemic species, by freshwater ecoregion. The map of the number of freshwater endemic species shows the number of endemic fish, freshwater turtles, crocodiles, and amphibians found in each freshwater ecoregion. To calculate the total number of endemic species by ecoregion, we simply added the number of endemic species in these four taxonomic groups. Fish endemics are from Abell et al. (2008). Extirpated fish species are included in these tallies, but resolved extinct species, as determined by the Committee on Recently Extinct Organisms, and introduced species are excluded. Data on amphibian species were generated from distribution maps for 5,640 amphibian species gathered by the Global Amphibian...
|

|
