Filters: Tags: Ecoregions (X)
88 results (44ms)|
Filters
|

This dataset depicts the Level I ecological regions of North America, as compiled by the Commission for Environmental Cooperation (CEC). These draft files of of Level I, II, and III ecological regions of North America are an update and revision of files developed by Canada, the United States, and Mexico in the late 1990's in a cooperative project for the Commission for Environmental Cooperation (CEC 1997). The CEC was created under the North American Agreement on Environmental Cooperation (NAAEC) to address regional environmental concerns, help prevent potential trade and environmental conflicts and promote the effective enforcement of environmental law. The Agreement complements the environmental provisions established...

Dataset created by the Food and Agriculture Organization (FAO) to identify major global ecofloristic zones. It was used by the IPCC to categorize carbon stock estimates. Each of the 20 ecoregions are characterized by their temperature regime (tropical, subtropical, temperate, boreal, and polar) and their vegetation type (humid forest, dry forest, moist deciduous forest, shrubland, steppe, desert, etc.).
Number of amphibian species, by freshwater ecoregion. We calculated the number of amphibian species per freshwater ecoregion using species range maps of the Global Amphibian Assessment (GAA, www.iucnredlist.org/amphibians) (IUCN et al. 2006). The 2006 GAA assessed 5,918 amphibian species and provided distribution maps for 5,640 of those species. When a range overlapped several ecoregions, we counted species as present in all those ecoregions that had part of the range. This may have resulted in an overestimate of species numbers in some ecoregions, especially those that are long and narrow in shape. This is particularly true for the Amazonas High Andes ecoregion (312), where the mountain range has been used as...

A map service on the www depicting ecological section boundaries within the conterminous United States. The map service contains regional geographic delineations for analysis of ecological relationships across ecological units. http://fsgeodata.fs.fed.us/clearinghouse/other_resources/ecosubregions.html. Baseline map of the ecological boundaries. Ecological analysis of resource distribution patterns and associations among different ecological land units.
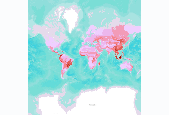
Number of globally threatened animals, by terrestrial ecoregion. We compiled a vertebrate species list for each ecoregion from WWF’s WildFinder database (WWF 2006). This list was then compared against the IUCN Red List of Threatened Species (2008) to determine the number of species per ecoregion that are threatened. Threatened species are those listed by IUCN Red List as Vulnerable, Endangered, or Critically Endangered (www.redlist.org). These data were derived by The Nature Conservancy, and were displayed in a map published in The Atlas of Global Conservation (Hoekstra et al., University of California Press, 2010). More information at http://nature.org/atlas. Data derived from: World Wildlife Fund (WWF). 2006....

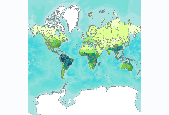
Number of mammal species, by terrestrial ecoregion. We compiled data on terrestrial mammals by querying the WWF WildFinder database for species occurrences by ecoregion. The WWF WildFinder database is a spatially explicit online database of vertebrate species occurrences by ecoregion. These data were displayed in a map published in The Atlas of Global Conservation (Hoekstra et al., University of California Press, 2010). More information at http://nature.org/atlas.
This map shows EPA Level IV ecoregions within the Sonoran Desert ecoregion. These data are provided by Bureau of Land Management (BLM) "as is" and may contain errors or omissions. The User assumes the entire risk associated with its use of these data and bears all responsibility in determining whether these data are fit for the User's intended use. These data may not have the accuracy, resolution, completeness, timeliness, or other characteristics appropriate for applications that potential users of the data may contemplate. The User is encouraged to carefully consider the content of the metadata file associated with these data. The BLM should be cited as the data source in any products derived from these data.
This dataset was developed for the Atlas of Pacific Salmon: The First Map-Based Status Assessment of Salmon in the North Pacific. (2005)
Categories: Data;
Types: Downloadable,
Map Service,
OGC WFS Layer,
OGC WMS Layer,
Shapefile;
Tags: Oncorhynchus gorbuscha,
Oncorhynchus tschawytscha,
Anadromous Resources,
Chum,
Coho ,

WWF's Global 200 is a first attempt to identify a set of ecoregions whose conservation would achieve the goal of saving a broad diversity of the Earth's ecosystems. These ecoregions include those with exceptional levels of biodiversity, such as high species richness or endemism, or those with unusual ecological or evolutionary phenomena. Tropical rain forests deservedly garner much conservation attention, as they may contain half of the world's species. However, a comprehensive strategy for conserving global biodiversity must strive to include the other 50 percent of species and habitats, such that all species and the distinctive ecosystems that support them are conserved. Habitats like tropical dry forests, tundra,...

This dataset depicts the Level III ecological regions of North America, as compiled by the Commission for Environmental Cooperation (CEC). These draft files of of Level I, II, and III ecological regions of North America are an update and revision of files developed by Canada, the United States, and Mexico in the late 1990's in a cooperative project for the Commission for Environmental Cooperation (CEC 1997). The CEC was created under the North American Agreement on Environmental Cooperation (NAAEC) to address regional environmental concerns, help prevent potential trade and environmental conflicts and promote the effective enforcement of environmental law. The Agreement complements the environmental provisions established...

A regionalization that classifies the Northern Appalachian/Acadian Ecoregion into distinct areas of increasingly uniform ecological potentials. The Biophysical Area types are mapped based on associations of those biotic and environmental factors that directly affect or indirectly express energy, moisture, and nutrient gradients which regulate the structure and function of ecosystems. These factors include climate, physiography, water, soils, air, hydrology, and potential natural communities.
Note: A new version of these statistics based on PAD-US 2.0 will be made available in 2020 here. This summary of the Protected Areas Database of the United States (PAD-US) is created to provide land managers and decision makers with a general summary of management for conservation, natural resource management and recreation. Area statistics include total acreage, acres by managing agency and percent protection. These summaries are available for the nation and by state. The PAD-US 1.4 Combined feature class (with Marine Protected Areas removed) was modified to remove overlaps, avoiding overestimation in protected area statistic summaries. A Python scripted process prioritized overlapping designations (for example,...
Land facets were created by combining 3 rasters: elevation (seven 600-m bands), soil orders (11 classes) and slope (3 breaks) to produce a 270-m resolution grid. 162 land facets were created, ranging in size from over 9 million hectares in the plateaus of the Columbia Plateau to less than 1,000 hectares in steep, high elevation habitats. These 162 facets were stratified by ecoregions to produce 794 ecofacets which underlie the spatial distribution of biodiversity and the region’s biological richness. Soil Order: Soil orders reflect both geology and time and are based largely on soil forming processes, including exposure to climatic factors and biological processes, as indicated by the presence or absence of major...

Number of freshwater fish species, by freshwater ecoregion. The map of freshwater fish species richness—the number of species present in each ecoregion—was generated from a variety of sources by Abell et al. (2008). Only species using freshwater for at least a portion of their life cycles, as identified using the habitat assignments in FishBase, are included. For the United States, NatureServe provided presence/absence data for individual species, coded to eight-digit hydrologic unit codes (HUCs); these HUC occurrences were then translated into ecoregions, and the data were manually cleaned of erroneous occurrences derived from species introductions and problematic records. For all other ecoregions, species lists...

Oregon Ecoregions, developed and released by Oregon Biodiversity Information Center (ORBIC), March 2010. Based on US EPA Level III Ecoregions, with an additional Marine/Estuary Ecoregion that includes major estuaries and the oceanic nearshore and continental shelf. Oregon Ecoregions modify the US EPA Level III Ecoregions and are clipped to jurisdictional borders of Oregon. In the Coast Range and Marine/Estuary ecoregions, water/land interfaces, including coastal and riverine islands, and marine and estuarine waters, are presented in much greater detail than the delineations in the EPA shapefile. [from the original EPA Level III Ecoregion metadata]: The Level III EPA Ecoregions have been derived from Omernik (1987)...

Human population density in 2000, by terrestrial ecoregion. We summarized human population density by ecoregion using the Gridded Population of the World database and projections for 2015 (CIESIN et al. 2005). The mean for each ecoregion was extracted using a zonal statistics algorithm. These data were derived by The Nature Conservancy, and were displayed in a map published in The Atlas of Global Conservation (Hoekstra et al., University of California Press, 2010). More information at http://nature.org/atlas. Data derived from: Center for International Earth Science Information Network (CIESIN), Columbia University; and Centro Internacional de Agricultura Tropical (CIAT). 2005. Gridded Population of the World...

Percent of ecoregion area covered with desert and aridland habitat. We derived the aridlands map by first developing a raster-based mask of arid climates from the Köppen-Geiger climate classification (Kottek et al. 2006) using ArcInfo GIS software. We applied the mask to the GLC 2000 global land cover, and then extracted sparse vegetation classes. For example, pockets of forested land occurring within Köppen-Geiger arid climate regions were excluded. Areas of human habitation and infrastructure were also removed from the map, leaving only natural desert lands. Finally, we applied a zonal sum procedure to the raster map to calculate the percentage of arid land per ecoregion. These data were derived by The Nature...

Number of migratory fish species, by freshwater ecoregion. We derived the map of long-distance migrant (LDM) fish—the number of LDM species per ecoregion—from published literature, online databases (NatureServe), and expert inquiries. Potadromous, anadromous, amphidromous, and catadromous fish species were judged to be LDMs if they made regular journeys (i.e., for breeding, dispersal, feeding) of at least a hundred kilometers or more in freshwater. These species were then assigned to ecoregions based on the fish species lists database from Abell et al. (2008). Although we used many resources, two key data sources for the map were the following: Carolsfeld, J., B. Harvey, C. Ross, and A. Baer, eds. 2003. Migratory...

Percent of ecoregion area covered with forest habitat. We derived the forest map from forest and woodland classes of the Global Land Cover 2000 data set (JRC 2003) with areas of human habitation and infrastructure from the Global Rural-Urban Mapping Project database (CIESIN et al. 2004) removed. We applied a zonal sum procedure to those data to show the amount of forest by ecoregion. These data were derived by The Nature Conservancy, and were displayed in a map published in The Atlas of Global Conservation (Hoekstra et al., University of California Press, 2010). More information at http://nature.org/atlas. Data derived from: Center for International Earth Science Information Network (CIESIN), International Food...
Major ecosystems have been mapped and described for the State of Alaska and nearby areas. Ecoregion units are based on newly available datasets and field experience of ecologists, biologists, geologists and regional experts. Recently derived datasets for Alaska included climate parameters, vegetation, surficial geology and topography. Additional datasets incorporated in the mapping process were lithology, soils, permafrost, hydrography, fire regime and glaciation. Thirty two units are mapped using a combination of the approaches of Bailey (hierarchial), and Omernick (integrated). The ecoregions are grouped into two higher levels using a "tri-archy" based on climate parameters, vegetation response and disturbance...
|

|
