Filters: Tags: Fargo (X)
41 results (1.1s)|
Filters
Date Range
Extensions Types
Contacts
Categories Tag Types Tag Schemes |
The dataset contains estimates for total phosphorus flux from wastewater treatment plants that discharge to surface water within the Red River of the North Basin in the United States and subbasins. Shapefiles defining the subbasins are available as part of the same data release in which these data are published. Estimates of wastewater treatment plant total phosphorus flux (or load) were calculated by Tammy Ivanhnenko for the years 1978, 1980, 1982, 1984, 1986, 1988, 1990, 1992, 1996, 2000, 2004, 2008, and 2012. Flux estimates were based on the average discharge from the wastewater treatment plants and treatment level, both reported as part of the U.S. Environmental Protection Agency's Clean Watershed Needs Survey,...
This data set contains imagery from the National Agriculture Imagery Program (NAIP). The NAIP program is administered by USDA FSA and has been established to support two main FSA strategic goals centered on agricultural production. These are, increase stewardship of America's natural resources while enhancing the environment, and to ensure commodities are procured and distributed effectively and efficiently to increase food security. The NAIP program supports these goals by acquiring and providing ortho imagery that has been collected during the agricultural growing season in the U.S. The NAIP ortho imagery is tailored to meet FSA requirements and is a fundamental tool used to support FSA farm and conservation programs....
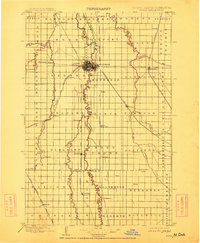
USGS Historical Quadrangle in GeoPDF.
This data shows select streamgage locations throughout the Red River of the North Basin upstream of Emerson, Manitoba, and basin outlines for eight subbasins..
Categories: Data;
Types: Citation,
Downloadable,
Map Service,
OGC WFS Layer,
OGC WMS Layer,
Shapefile;
Tags: Crookston,
Emerson,
Fargo,
Halstad,
Kindred,
USGS Historical Quadrangle in GeoPDF.
USGS Historical Quadrangle in GeoPDF.
USGS Historical Quadrangle in GeoPDF.
USGS Historical Quadrangle in GeoPDF.
USGS Historical Quadrangle in GeoPDF.
USGS Historical Quadrangle in GeoPDF.
USGS Historical Quadrangle in GeoPDF.
USGS Historical Quadrangle in GeoPDF.
The dataset contains estimates of annual flow and annual flux in kilograms for six sites in the Red River of the North Basin (identified as basin 1, 2, 3, 4, 5, and 8). The shape files that are part of this data release document the basins and the streamgage locations are also provided in an associated shape file.
USGS Historical Quadrangle in GeoPDF.
These data report the percent of crop acreage, within each basin (basins 1-8, see accompanying shapefiles), enrolled in the Conservation Reserve Program (CRP).
These data describe the percent of cropland harvested as wheat, corn, and soybean within each basin (basins 1-8, see accompanying shapefiles). Data are available for other crops; however, these three were chosen because wheat is a traditional crop that has been grown for a long time in the Basin and corn and soybeans have increased in recent times because of wetter conditions, the demand for biofuels, and advances in breeding short-season, drought-tolerant crops. The data come from the National Agricultural Statistics Service (NASS) Census of Agriculture (COA) and have estimates for 1974, 1978, 1982, 1986, 1992, 1997, 2002, 2007, and 2012. Years with missing data were estimated estimated using multivariate imputation...
This data set contains imagery from the National Agriculture Imagery Program (NAIP). The NAIP program is administered by USDA FSA and has been established to support two main FSA strategic goals centered on agricultural production. These are, increase stewardship of America's natural resources while enhancing the environment, and to ensure commodities are procured and distributed effectively and efficiently to increase food security. The NAIP program supports these goals by acquiring and providing ortho imagery that has been collected during the agricultural growing season in the U.S. The NAIP ortho imagery is tailored to meet FSA requirements and is a fundamental tool used to support FSA farm and conservation programs....
USGS Historical Quadrangle in GeoPDF.
USGS Historical Quadrangle in GeoPDF.
USGS Historical Quadrangle in GeoPDF.
|

|
