Filters: Tags: Fernandina Beach (X)
21 results (93ms)|
Filters
Date Range
Extensions Types Contacts
Categories Tag Types Tag Schemes |
This data set contains imagery from the National Agriculture Imagery Program (NAIP). The NAIP program is administered by USDA FSA and has been established to support two main FSA strategic goals centered on agricultural production. These are, increase stewardship of America's natural resources while enhancing the environment, and to ensure commodities are procured and distributed effectively and efficiently to increase food security. The NAIP program supports these goals by acquiring and providing ortho imagery that has been collected during the agricultural growing season in the U.S. The NAIP ortho imagery is tailored to meet FSA requirements and is a fundamental tool used to support FSA farm and conservation programs....
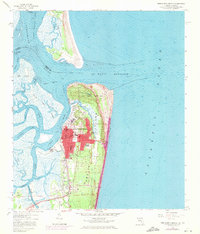
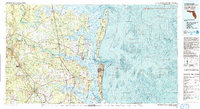
USGS Historical Quadrangle in GeoPDF.
USGS Historical Quadrangle in GeoPDF.
This data set contains imagery from the National Agriculture Imagery Program (NAIP). The NAIP program is administered by USDA FSA and has been established to support two main FSA strategic goals centered on agricultural production. These are, increase stewardship of America's natural resources while enhancing the environment, and to ensure commodities are procured and distributed effectively and efficiently to increase food security. The NAIP program supports these goals by acquiring and providing ortho imagery that has been collected during the agricultural growing season in the U.S. The NAIP ortho imagery is tailored to meet FSA requirements and is a fundamental tool used to support FSA farm and conservation programs....
Sandy ocean beaches in the United States are popular tourist and recreational destinations and constitute some of the most valuable real estate in the country. The boundary between land and water along the coastline is often the location of concentrated residential and commercial development and is frequently exposed to a range of natural hazards, which include flooding, storm effects, and coastal erosion. In response, the U.S. Geological Survey (USGS) is conducting a national assessment of coastal change hazards. One component of this research effort, the National Assessment of Shoreline Change Project (http://coastal.er.usgs.gov/shoreline-change/), documents changes in shoreline position as a proxy for coastal...
Categories: Data;
Types: Citation,
Downloadable,
Map Service,
OGC WFS Layer,
OGC WMS Layer,
Shapefile;
Tags: Atlantic Coast,
CMGP,
Cape Canaveral,
Coastal and Marine Geology Program,
DSAS,
This data set contains imagery from the National Agriculture Imagery Program (NAIP). The NAIP program is administered by USDA FSA and has been established to support two main FSA strategic goals centered on agricultural production. These are, increase stewardship of America's natural resources while enhancing the environment, and to ensure commodities are procured and distributed effectively and efficiently to increase food security. The NAIP program supports these goals by acquiring and providing ortho imagery that has been collected during the agricultural growing season in the U.S. The NAIP ortho imagery is tailored to meet FSA requirements and is a fundamental tool used to support FSA farm and conservation programs....
Sandy ocean beaches in the United States are popular tourist and recreational destinations and constitute some of the most valuable real estate in the country. The boundary between land and water along the coastline is often the location of concentrated residential and commercial development and is frequently exposed to a range of natural hazards, which include flooding, storm effects, and coastal erosion. In response, the U.S. Geological Survey (USGS) is conducting a national assessment of coastal change hazards. One component of this research effort, the National Assessment of Shoreline Change Project (http://coastal.er.usgs.gov/shoreline-change/), documents changes in shoreline position as a proxy for coastal...
Categories: Data;
Types: Citation,
Downloadable,
Map Service,
OGC WFS Layer,
OGC WMS Layer,
Shapefile;
Tags: Accretion,
Atlantic Coast,
CMGP,
Cape Canaveral,
Coastal and Marine Geology Program,
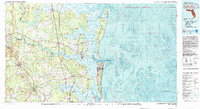
USGS Historical Quadrangle in GeoPDF.
USGS Historical Quadrangle in GeoPDF.
USGS Historical Quadrangle in GeoPDF.
Sandy ocean beaches in the United States are popular tourist and recreational destinations and constitute some of the most valuable real estate in the country. The boundary between land and water along the coastline is often the location of concentrated residential and commercial development and is frequently exposed to a range of natural hazards, which include flooding, storm effects, and coastal erosion. In response, the U.S. Geological Survey (USGS) is conducting a national assessment of coastal change hazards. One component of this research effort, the National Assessment of Shoreline Change Project (http://coastal.er.usgs.gov/shoreline-change/), documents changes in shoreline position as a proxy for coastal...
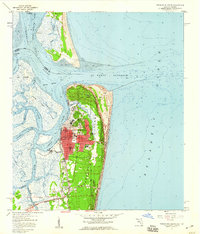
Categories: Data;
Types: Citation,
Downloadable,
Map Service,
OGC WFS Layer,
OGC WMS Layer,
Shapefile;
Tags: Atlantic Coast,
Baseline,
CMGP,
Cape Canaveral,
Coastal and Marine Geology Program,
USGS Historical Quadrangle in GeoPDF.
Sandy ocean beaches in the United States are popular tourist and recreational destinations and constitute some of the most valuable real estate in the country. The boundary between land and water along the coastline is often the location of concentrated residential and commercial development and is frequently exposed to a range of natural hazards, which include flooding, storm effects, and coastal erosion. In response, the U.S. Geological Survey (USGS) is conducting a national assessment of coastal change hazards. One component of this research effort, the National Assessment of Shoreline Change Project (http://coastal.er.usgs.gov/shoreline-change/), documents changes in shoreline position as a proxy for coastal...
Categories: Data;
Types: Citation,
Downloadable,
Map Service,
OGC WFS Layer,
OGC WMS Layer,
Shapefile;
Tags: Accretion,
Atlantic Coast,
CMGP,
Cape Canaveral,
Coastal and Marine Geology Program,
USGS Historical Quadrangle in GeoPDF.
|

|
