Filters: Tags: Forest (X)
1,189 results (29ms)|
Filters
Date Range
Extensions Types Contacts
Categories Tag Types
|
This data set contains imagery from the National Agriculture Imagery Program (NAIP). The NAIP program is administered by USDA FSA and has been established to support two main FSA strategic goals centered on agricultural production. These are, increase stewardship of America's natural resources while enhancing the environment, and to ensure commodities are procured and distributed effectively and efficiently to increase food security. The NAIP program supports these goals by acquiring and providing ortho imagery that has been collected during the agricultural growing season in the U.S. The NAIP ortho imagery is tailored to meet FSA requirements and is a fundamental tool used to support FSA farm and conservation programs....
This data set contains imagery from the National Agriculture Imagery Program (NAIP). The NAIP program is administered by USDA FSA and has been established to support two main FSA strategic goals centered on agricultural production. These are, increase stewardship of America's natural resources while enhancing the environment, and to ensure commodities are procured and distributed effectively and efficiently to increase food security. The NAIP program supports these goals by acquiring and providing ortho imagery that has been collected during the agricultural growing season in the U.S. The NAIP ortho imagery is tailored to meet FSA requirements and is a fundamental tool used to support FSA farm and conservation programs....
This data set contains imagery from the National Agriculture Imagery Program (NAIP). The NAIP program is administered by USDA FSA and has been established to support two main FSA strategic goals centered on agricultural production. These are, increase stewardship of America's natural resources while enhancing the environment, and to ensure commodities are procured and distributed effectively and efficiently to increase food security. The NAIP program supports these goals by acquiring and providing ortho imagery that has been collected during the agricultural growing season in the U.S. The NAIP ortho imagery is tailored to meet FSA requirements and is a fundamental tool used to support FSA farm and conservation programs....
This data set contains imagery from the National Agriculture Imagery Program (NAIP). The NAIP program is administered by USDA FSA and has been established to support two main FSA strategic goals centered on agricultural production. These are, increase stewardship of America's natural resources while enhancing the environment, and to ensure commodities are procured and distributed effectively and efficiently to increase food security. The NAIP program supports these goals by acquiring and providing ortho imagery that has been collected during the agricultural growing season in the U.S. The NAIP ortho imagery is tailored to meet FSA requirements and is a fundamental tool used to support FSA farm and conservation programs....
This data set contains imagery from the National Agriculture Imagery Program (NAIP). The NAIP program is administered by USDA FSA and has been established to support two main FSA strategic goals centered on agricultural production. These are, increase stewardship of America's natural resources while enhancing the environment, and to ensure commodities are procured and distributed effectively and efficiently to increase food security. The NAIP program supports these goals by acquiring and providing ortho imagery that has been collected during the agricultural growing season in the U.S. The NAIP ortho imagery is tailored to meet FSA requirements and is a fundamental tool used to support FSA farm and conservation programs....
This data set contains imagery from the National Agriculture Imagery Program (NAIP). The NAIP program is administered by USDA FSA and has been established to support two main FSA strategic goals centered on agricultural production. These are, increase stewardship of America's natural resources while enhancing the environment, and to ensure commodities are procured and distributed effectively and efficiently to increase food security. The NAIP program supports these goals by acquiring and providing ortho imagery that has been collected during the agricultural growing season in the U.S. The NAIP ortho imagery is tailored to meet FSA requirements and is a fundamental tool used to support FSA farm and conservation programs....
This data set contains imagery from the National Agriculture Imagery Program (NAIP). The NAIP program is administered by USDA FSA and has been established to support two main FSA strategic goals centered on agricultural production. These are increase stewardship of America's natural resources while enhancing the environment, and to ensure commodities are procured and distributed effectively and efficiently to increase food security. The NAIP program supports these goals by acquiring and providing ortho imagery that has been collected during the agricultural growing season in the U.S. The NAIP ortho imagery is tailored to meet FSA requirements and is a fundamental tool used to support FSA farm and conservation programs....

Pacific-slope Flycatcher station lifetime productivity (STAPI) (log transformed) ranged between -0.034 and +0.606 with a mean value of +0.286 and a median value of +0.247. ________________________________________ Model 1 (3 parameters) Pacific-slope Flycatcher station lifetime productivity (STAPI) (log transformed) was a function of: a) INTERCEPT (0.3022), b) NLCD06AF90P (+0.01874) - percent all forest cover, 90m-resolution(3x aggregation of 30m-resolution), ranged between -1.901 and +6.011 (95% CL) with a mean value of +2.055 and a median value of +2.494, c) NLCD06IM33P (-0.02730) - percent impervious cover, 990m-resolution (33x aggregation of 30m-resolution), ranged between -1.057 and +5.084 (95% CL) with...
Electric utilities in the US have initiated forestry projects to conserve energy and to oset carbon dioxide (CO2) emissions. In 1995, 40 companies raised US$2.5 million to establish the non-pro®t UtiliTree Carbon Company which is now sponsoring eight projects representing a mix of rural tree planting, forest preservation, forest management and research eorts at both domestic (Arkansas, Louisiana, Mississippi, and Oregon) and international sites (Belize and Malaysia). The projects include extensive external veri®cation. Such forestry projects Ð properly documented, monitored and veri®ed Ð should be a component of domestic and international strategies to address greenhouse gas (GHG) emissions, due to GHG bene®ts,...
Categories: Publication;
Types: Citation;
Tags: Carbon dioxide,
Electric,
Forest,
Greenhouse,
Manage,

Link to brief summary
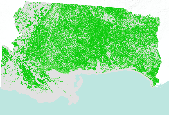
This dataset portrays percent tree canopy coverage for NLCD mapping superzone twelve (south), covering parts of Louisiana, Mississippi, Alabama, Florida, and Arkansas . Refer to http://www.mrlc.gov/nlcd_multizone_map.php for a map of the superzones. From NLCD: The National Land Cover Database 2001 was produced through a cooperative project conducted by the Multi-Resolution Land Characteristics (MRLC) Consortium. The MRLC Consortium is a partnership of federal agencies (www.mrlc.gov), consisting of the U.S. Geological Survey (USGS), the National Oceanic and Atmospheric Administration (NOAA), the U.S. Environmental Protection Agency (EPA), the U.S. Department of Agriculture (USDA), the U.S. Forest Service (USFS),...

This dataset represents presence of Jack Pine (Pinus banksiana) in Minnesota (USA) at year 50 (2045) from a single model run of LANDIS-II. The simulation assumed Intergovernmental Panel on Climate Change (IPCC) B2 emissions (moderate) and used the Hadley 3 global circulation model. Restoration harvest rates and intensities were simulated.

This dataset represents presence of Sugar Maple (Acer saccharum) in Minnesota (USA) at year 0 (2145) from a single model run of LANDIS-II. The simulation assumed Intergovernmental Panel on Climate Change (IPCC) B2 emissions (moderate) and used the Hadley 3 global circulation model. Contemporary harvest rates and intensities were simulated.

This map depicts the forested regions in the western United States. Data was obtained from the the Sagestitch map and other state-level GAP landcover maps and merged into 90m raster dataset.

A nationally compiled dataset containing provincial Forest Tenures/Forest Management Areas and other administrative areas where rights to establish, grow, harvest or remove timber from a particular area of land has been granted. Each province has different boundary definitions and/or harvesting practices which prevents this dataset from having a standard defined tenure unit for all of Canada (See data sources in metadata). British Columbia was the only province where tenure boundaries had to be complied from several different sources in order to have a definable tenure unit comparable to other provinces (see NOTES in metadata).

This dataset displays the boundaries of Intact Forest Landscapes for the Kenai region of the state of Alaska. Intact Forest Landscapes are defined as areas at least 50,000 hectares that are absent of human disturbance visible on satellite imagery (e.g., roads, logging, mining, settlement). For more information, see the full report, available on the Global Forest Watch website (www.globalforestwatch.org), or the Conservation Biology Institute website (http://www.consbio.org/cbi/projects/show.php?page=alaska);.

A nationally compiled dataset containing provincial Forest Tenures/Forest Management Areas and other administrative areas where rights to establish, grow, harvest or remove timber from a particular area of land has been granted. Each province has different boundary definitions and/or harvesting practices which prevents this dataset from having a standard defined tenure unit for all of Canada (See data sources in metadata). British Columbia was the only province where tenure boundaries had to be complied from several different sources in order to have a definable tenure unit comparable to other provinces (see NOTES in metadata).

Forest cover types (deciduous forest (41), evergreen forest (42), mixed forest (43), shrub/scrub (52), woody wetland (90)) were isolated from the 2001 National Land Cover Dataset (1 = forest, 0 = non-forest). To improve processing time of running a large focal mean across an expansive region, the “aggregate” tool was applied to the forest grid and re-sampled the 30 m pixels to 90 m using the mean aggregate option (i.e., the result is new 90 m pixels representing the proportion of forest in 9 pixels). A 10 km circular focal mean was applied to the aggregated grid resulting in a new floating point raster containing the proportion of forest within 10 km of each 90 m pixel. These values were multiplied by 100, rounded...

This dataset represents presence of white pine (Pinus strobus) at year 100 (2095) from a single model run of LANDIS-II. The simulation assumed Intergovernmental Panel on Climate Change (IPCC) B2 emissions (moderate) and used the Hadley 3 global circulation model. Contemporary harvest rates and intensities were simulated.
|

|

